
1. Introduction
1.1 Defining Value Stream Mapping
Value Stream Mapping (VSM) is a visual tool that systematically analyzes the flow of materials and information through a process. It is an integral part of Lean methodology, designed to identify inefficiencies, bottlenecks, and non-value-adding activities. By mapping out the current state and envisioning an optimized future state, organizations can strategically refine their workflows and enhance operational efficiency.
VSM is particularly useful in manufacturing, healthcare, and service industries where complex processes require meticulous streamlining. In this guide we will learn in detail how to create a value stream Map step by step.
1.2 Why Value Stream Mapping is Essential
In any industry, process inefficiencies can lead to increased costs, longer lead times, and diminished customer satisfaction. Value Stream Mapping offers a structured approach to pinpoint these inefficiencies, making waste reduction more actionable.
By visualizing the entire workflow, organizations can uncover redundancies, optimize resource allocation, and improve throughput. Moreover, VSM promotes cross-functional collaboration, ensuring that all stakeholders contribute to a more streamlined and responsive operational model.
1.3 The Role of Value Stream Mapping in Lean Manufacturing
Lean manufacturing prioritizes efficiency, waste reduction, and continuous improvement. Value Stream Mapping plays a crucial role in these objectives by providing a clear, data-driven representation of existing workflows. It helps businesses transition from reactive problem-solving to proactive process optimization.
Beyond manufacturing, VSM is instrumental in improving service delivery, administrative workflows, and supply chain management, making it a versatile tool for any organization striving for operational excellence.

2. Understanding the Basics of Value Stream Mapping
2.1 What is a Value Stream? Identifying the Flow of Value
A value stream encompasses all the activities required to transform raw materials into a finished product or service delivered to the customer. This includes both value-adding activities (those that directly contribute to product creation) and non-value-adding activities (those that cause delays or inefficiencies).
Identifying the flow of value helps organizations focus on what truly matters—delivering high-quality products and services efficiently.
2.2 Key Components of a Value Stream Map
A comprehensive Value Stream Map includes several key components:
- Process Steps: A sequential representation of all activities involved in production or service delivery.
- Material Flow: Depicts how raw materials or information move through the system.
- Information Flow: Illustrates the communication channels between stakeholders.
- Metrics and Performance Data: Includes cycle time, lead time, work-in-progress levels, and efficiency rates.
- Customer Demand: Establishes the takt time, ensuring alignment with customer expectations.
By integrating these components, businesses can create a holistic view of their operational workflow and make informed decisions on process enhancements.

2.3 The Difference Between Current State and Future State Maps
The Current State Map provides a detailed snapshot of the existing process, revealing inefficiencies, redundancies, and bottlenecks. It serves as a diagnostic tool to understand areas requiring improvement.
The Future State Map, on the other hand, is a redesigned workflow that incorporates Lean principles to eliminate waste and optimize efficiency. It acts as a blueprint for process improvements, guiding organizations toward their ideal operational state.
3. Preparing for Value Stream Mapping
3.1 Setting Clear Objectives
Before initiating a Value Stream Mapping exercise, organizations must define their primary objectives. Common goals include reducing lead time, minimizing waste, improving quality, and enhancing communication. Clear objectives provide direction and ensure that the VSM process aligns with overarching business strategies.
3.2 Selecting the Right Process for Mapping
Not all processes require mapping, so selecting the right one is crucial. Organizations should focus on high-impact areas that significantly influence cost, quality, and customer satisfaction. Ideal candidates for VSM include processes with frequent delays, excessive handoffs, or high defect rates. Prioritizing critical workflows ensures that improvements yield substantial benefits.
3.3 Gathering a Cross-Functional Team
Value Stream Mapping is most effective when it involves a diverse group of stakeholders. A cross-functional team may include:
- Process Operators: Those directly involved in day-to-day activities.
- Supervisors and Managers: Individuals overseeing operations and ensuring alignment with strategic goals.
- Lean Practitioners or Continuous Improvement Specialists: Experts in process optimization methodologies.
- Customers or End-Users: Providing insight into expectations and quality standards.
Engaging a diverse team fosters collaboration, ensures accuracy, and enhances the likelihood of successful implementation.
3.4 Tools and Materials Required for Creating a Value Stream Map
To create an effective Value Stream Map, several tools and materials are required:
Software Tools (Optional): Digital platforms like Microsoft Visio, Lucidchart, or specialized Lean software can enhance visualization and collaboration..
Mapping Symbols: Standardized icons representing process steps, information flow, and inventory levels.
Data Collection Sheets: Used to gather cycle times, lead times, and defect rates.
Whiteboards, Sticky Notes, and Markers: Facilitate brainstorming and iterative process adjustments.
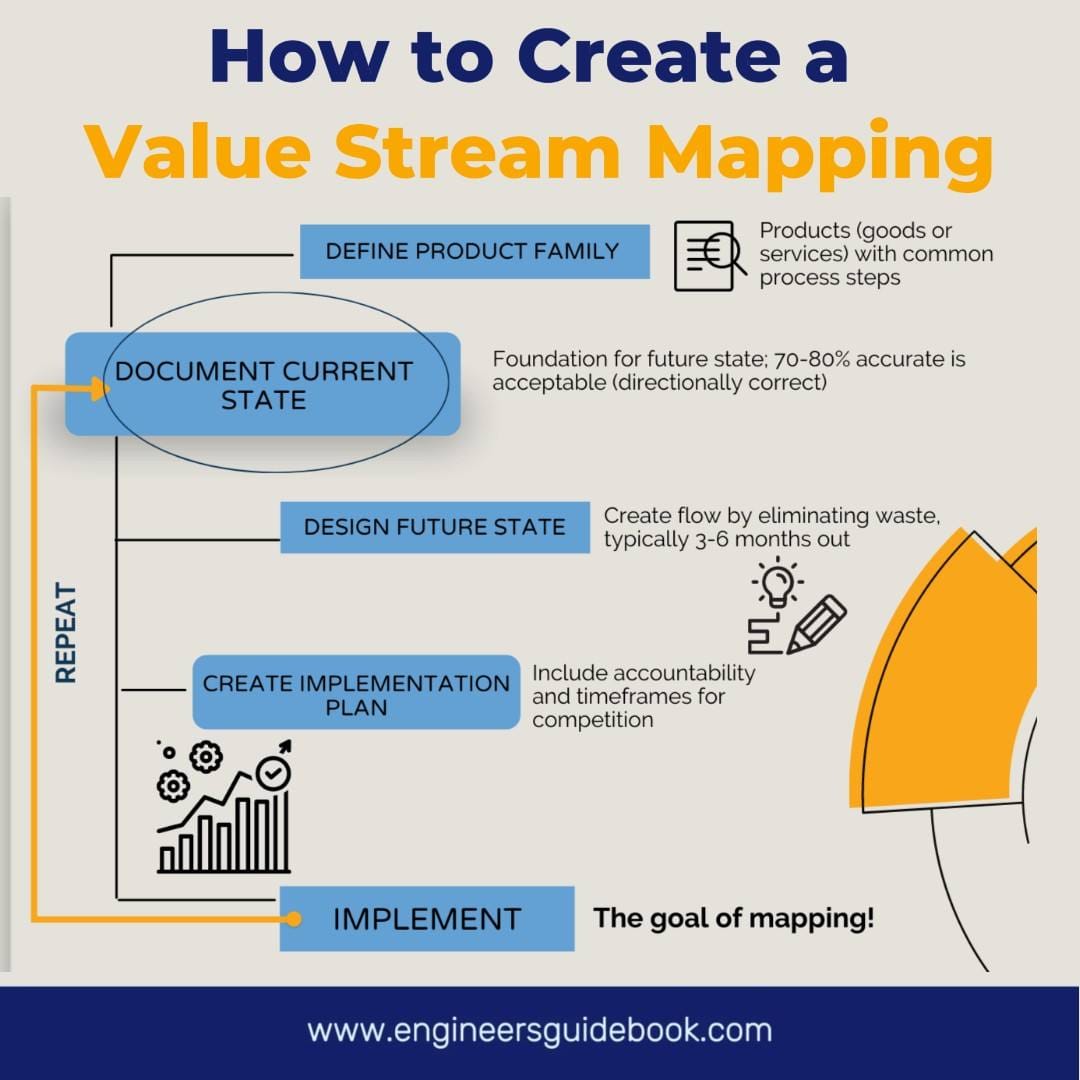
4. Step-by-Step Guide to Creating a Value Stream Map
4.1 Defining the Scope
Before embarking on the creation of a Value Stream Map (VSM), it is imperative to establish its scope. Clearly defining the start and end points ensures that the map remains focused and relevant. The scope should align with organizational objectives and target a specific process or product line.
Overextending the boundaries can lead to complexity, making the mapping exercise unwieldy and less effective. A well-defined scope provides clarity on constraints, available resources, and expected outcomes.
4.2 Identifying Customer Requirements
A fundamental aspect of value stream mapping is aligning operations with customer expectations. Understanding demand patterns, delivery timelines, and quality standards helps in designing a streamlined workflow.
This phase involves gathering data from customer feedback, order specifications, and market trends. Organizations must differentiate between value-added and non-value-added activities from the perspective of the end user to enhance customer satisfaction while eliminating inefficiencies.
4.3 Mapping the Current State
The current state map serves as a diagnostic tool to analyze the existing workflow. It includes all process steps, material movements, and information flows. Key elements such as processing time, inventory levels, and bottlenecks are documented.
By scrutinizing these factors, businesses can pinpoint inefficiencies and redundancies. The objective is to create an accurate representation of how work is currently being performed, which will serve as a foundation for future improvements.
4.4 Documenting Key Process Steps
Each step within the process must be meticulously documented to ensure transparency. Workflows should detail task sequences, decision points, and dependencies. Delays—such as waiting times, material shortages, or approval bottlenecks—should be explicitly noted. Inventory levels at various stages must be recorded to assess work-in-progress and storage inefficiencies. This documentation provides critical insights into areas where improvements can be made to enhance efficiency and reduce waste.
4.5 Tracking Information Flow
A value stream is not solely dependent on physical materials; information flow plays an equally crucial role. This step involves mapping the transmission of orders, instructions, and feedback within the system.
Inefficient data transfer mechanisms—such as outdated manual reporting, miscommunication, or information silos—often contribute to operational delays. By identifying these issues, organizations can optimize communication channels, integrate digital solutions, and ensure that real-time data is available where needed.
4.6 Measuring Process Metrics
To quantify process performance, key metrics such as lead time, cycle time, and efficiency must be analyzed. Lead time refers to the total time taken from the initiation of a request to the final delivery.
Cycle time measures the duration required to complete a specific task within the process. Efficiency is evaluated by comparing value-added time against total process time. By tracking these metrics, businesses can identify wasteful activities, optimize resource utilization, and implement strategies to enhance overall productivity.

5. Analyzing the Current State Map
5.1 Identifying Value-Adding and Non-Value-Adding Activities
A critical aspect of value stream analysis is distinguishing between value-adding and non-value-adding activities. Value-adding activities directly contribute to customer satisfaction by enhancing product or service quality. These include machining, assembly, and final inspection. Conversely, non-value-adding activities—such as excessive transportation, prolonged waiting times, and redundant inspections—introduce inefficiencies. By systematically categorizing each process step, businesses can isolate wasteful operations and develop strategies to either eliminate or minimize them, fostering a leaner production environment.
5.2 Recognizing Bottlenecks and Waste
Bottlenecks are the primary impediments to a smooth workflow, often manifesting as congestion points where demand exceeds capacity. Common bottlenecks include slow processing stations, labor shortages, and equipment failures. Waste, in its various forms—overproduction, defects, unnecessary motion, and underutilized talent—further exacerbates inefficiencies. Identifying these constraints within the current state map allows organizations to take corrective action, optimizing resource allocation and reducing lead times.

5.3 Evaluating Process Variability
Process variability, driven by inconsistent demand, machine downtime, or human error, leads to operational instability. Unpredictable fluctuations in cycle times and defect rates can disrupt supply chains and inflate costs. By leveraging statistical analysis and historical data, businesses can pinpoint the sources of variability, implement standardized procedures, and introduce automation where feasible. Reducing variability enhances predictability, ensuring a steady and reliable production flow.
6. Designing the Future State Map
6.1 Establishing a Leaner, More Efficient Workflow
The future state map serves as a blueprint for process optimization, emphasizing lean methodologies. It focuses on reducing waste, shortening lead times, and improving workflow synchronization. Key strategies include cellular manufacturing, load balancing, and continuous flow production.
By systematically restructuring the process flow, organizations can create a streamlined, high-performance system that meets customer demands with greater efficiency.
6.2 Implementing Pull Systems and Reducing Inventory
A pull-based system ensures that production is driven by actual demand rather than forecasted projections. Techniques such as Just-in-Time (JIT) manufacturing and Kanban systems help regulate material flow, reducing excessive inventory levels and associated holding costs.
Shifting from a push-driven approach to a demand-driven model enhances responsiveness while minimizing excess stock and obsolescence.
6.3 Streamlining Communication and Data Flow
Efficient communication and data transfer are integral to an optimized value stream. Real-time data sharing, integrated software solutions, and digital dashboards facilitate transparent decision-making and rapid problem resolution.
Eliminating delays in information relay between departments enhances coordination, reducing the likelihood of miscommunication and process errors.
6.4 Setting Targets for Process Improvement
To ensure continuous progress, businesses must define measurable targets aligned with operational objectives. These targets may include cycle time reductions, defect rate minimization, or cost savings through waste elimination.
Establishing Key Performance Indicators (KPIs) and monitoring them through regular assessments ensures that the future state map translates into tangible improvements.
7. Developing an Action Plan for Implementation
7.1 Prioritizing Improvement Opportunities
Once inefficiencies have been identified, prioritizing corrective measures is crucial. High-impact areas, such as eliminating critical bottlenecks or reducing excessive lead times, should be addressed first.
A structured approach—such as Pareto analysis—helps organizations focus on improvements that yield the most significant benefits.
7.2 Assigning Responsibilities
Clear accountability ensures successful implementation. Designating process owners, assigning cross-functional teams, and establishing leadership oversight are key components of an effective action plan.
Each team member must understand their role in driving improvements, fostering a culture of ownership and collaboration.
7.3 Setting Timelines and Milestones for Progress Tracking
Defining clear timelines and milestones helps maintain momentum. Short-term, mid-term, and long-term goals should be established, with regular progress reviews to measure success.
Utilizing project management tools, such as Gantt charts or Agile methodologies, ensures that corrective actions remain on track, leading to sustained operational enhancements
8. Common Challenges and How to Overcome Them
8.1 Resistance to Change
Change can be met with skepticism, especially when employees are accustomed to established workflows. Resistance often stems from uncertainty, fear of increased workload, or a lack of understanding of value stream mapping (VSM).
To gain team buy-in, leadership must communicate the benefits clearly, emphasizing how VSM enhances efficiency and reduces unnecessary burdens. Engaging employees early in the process, providing hands-on training, and encouraging their input fosters a sense of ownership.
Demonstrating quick wins through pilot projects can also help reinforce confidence in the methodology.
8.2 Addressing Data Inaccuracies
A value stream map is only as effective as the data it represents. Inaccurate or outdated information can lead to flawed decision-making and suboptimal improvements. To mitigate this risk, organizations must establish standardized data collection protocols, ensuring consistency across all departments.
Utilizing automation, real-time tracking systems, and validating data through cross-functional reviews enhance reliability. Encouraging transparency and collaboration between teams minimizes errors and ensures that the insights derived from VSM are actionable and precise.
8.3 Balancing Short-Term Fixes and Long-Term Improvements
Organizations often struggle to balance immediate process fixes with overarching strategic goals. While short-term adjustments can provide quick efficiency gains, focusing solely on immediate concerns without addressing systemic inefficiencies leads to recurring issues.
The key is to align short-term initiatives with long-term process optimization. Prioritizing improvements based on impact and feasibility, setting phased implementation plans, and maintaining a long-term vision ensure sustainable progress.
Regularly revisiting the value stream map helps recalibrate objectives and maintain a balance between tactical and strategic improvements.
9. Best Practices for Successful Value Stream Mapping
9.1 Engaging Stakeholders Throughout the Process
Value stream mapping should not be confined to a single department or leadership team. Engaging stakeholders from various functional areas—operations, logistics, finance, and customer service—ensures a comprehensive perspective.
Conducting collaborative workshops, facilitating open discussions, and incorporating feedback from frontline employees lead to a more accurate and actionable VSM. When all stakeholders are aligned, implementation becomes smoother, and resistance to change diminishes.

9.2 Continuously Updating and Refining Your Map
A value stream map is not a one-time exercise; it must evolve with the organization. As processes change, market demands fluctuate, and new inefficiencies emerge, regular updates to the VSM ensure its relevance. Establishing periodic review cycles, integrating feedback loops, and leveraging performance metrics help organizations refine their maps continuously. By treating VSM as a dynamic tool rather than a static document, businesses can adapt to evolving challenges and sustain efficiency improvements.
9.3 Integrating Value Stream Mapping with Continuous Improvement Initiatives
To maximize its impact, VSM should be embedded within broader continuous improvement frameworks such as Lean, Six Sigma, or Kaizen. Organizations that integrate VSM with structured problem-solving methodologies can drive sustained enhancements in operational efficiency. Leveraging key performance indicators (KPIs), conducting root cause analyses, and fostering a culture of innovation ensure that value stream mapping remains a powerful catalyst for long-term success.
10. Conclusion
When executed effectively, value stream mapping yields significant long-term benefits, including enhanced operational efficiency, reduced waste, and improved customer satisfaction. By providing a visual representation of the entire process, VSM enables organizations to make informed decisions and optimize resource allocation. Over time, the methodology fosters a leaner, more agile enterprise capable of adapting to dynamic business environments.
Embarking on a VSM initiative begins with setting clear objectives, securing leadership commitment, and assembling a cross-functional team. Starting with a pilot project allows organizations to refine their approach before scaling the methodology across multiple processes. Leveraging digital tools and automation further streamlines implementation, accelerating the realization of benefits.
Ultimately, value stream mapping is not just a tool it is a mindset. Organizations that cultivate a culture of continuous improvement empower employees to identify inefficiencies and propose solutions proactively. Encouraging open communication, rewarding innovative ideas, and institutionalizing regular process evaluations create an environment where efficiency and excellence become ingrained in daily operations. By fostering this culture, businesses ensure that the principles of VSM translate into sustainable, long-term success.
ionalizing regular process evaluations create an environment where efficiency and excellence become ingrained in daily operations. By fostering this culture, businesses ensure that the principles of VSM translate into sustainable, long-term success.
11. FAQs
1. What is the primary purpose of Value Stream Mapping?
Value Stream Mapping (VSM) is used to visualize and analyze the flow of materials and information through a process. Its primary goal is to identify inefficiencies, eliminate waste, and improve overall workflow by designing a more streamlined and effective future state.
2. How does Value Stream Mapping differ from process mapping?
While both techniques focus on process visualization, Value Stream Mapping takes a broader approach by considering not only process steps but also material flow, information exchange, and lead times. Traditional process mapping generally focuses on individual workflows without emphasizing overall efficiency and waste reduction.
3. What are the key symbols used in a Value Stream Map?
Common symbols in a Value Stream Map include:
- Process boxes for each step in the workflow.
- Arrows to indicate material or information flow.
- Inventory triangles to show work-in-progress (WIP).
- Data boxes containing key process metrics such as cycle time, lead time, and takt time.
- Kaizen bursts to highlight areas requiring improvement.
4. How do you determine which process to map?
The ideal process for Value Stream Mapping is one that directly impacts customer satisfaction and business efficiency. Organizations typically start by mapping high-impact areas such as production lines, service delivery workflows, or supply chain operations to maximize improvement potential.
5. What are the most common challenges when implementing Value Stream Mapping?
Challenges include:
- Resistance to change from employees or management.
- Data inaccuracies leading to unreliable process analysis.
- Difficulty in balancing short-term fixes with long-term strategic improvements.
- Lack of stakeholder engagement, which can hinder the implementation of process changes.
6. Can Value Stream Mapping be applied to service industries?
Yes, while originally developed for manufacturing, Value Stream Mapping is widely used in service industries such as healthcare, logistics, and software development. It helps optimize customer service processes, reduce lead times, and improve overall efficiency.
7. How often should Value Stream Maps be updated?
Value Stream Maps should be regularly reviewed and updated, especially when there are significant process changes, technological advancements, or shifts in customer demands. Organizations engaged in continuous improvement may update their maps quarterly or annually.
8. What tools or software can be used to create a Value Stream Map?
While traditional Value Stream Maps can be drawn manually on paper or whiteboards, various software tools like Microsoft Visio, Lucidchart, Minitab, and specialized lean management tools offer digital solutions for creating and analyzing Value Stream Maps efficiently.


2 Responses
Spot on with this write-up, I absolutely believe that this web site needs a
great deal more attention. I’ll probably be back again to see more, thanks for the advice!
This web site certainly has all of the information and facts I needed about this subject and didn’t know who
to ask.