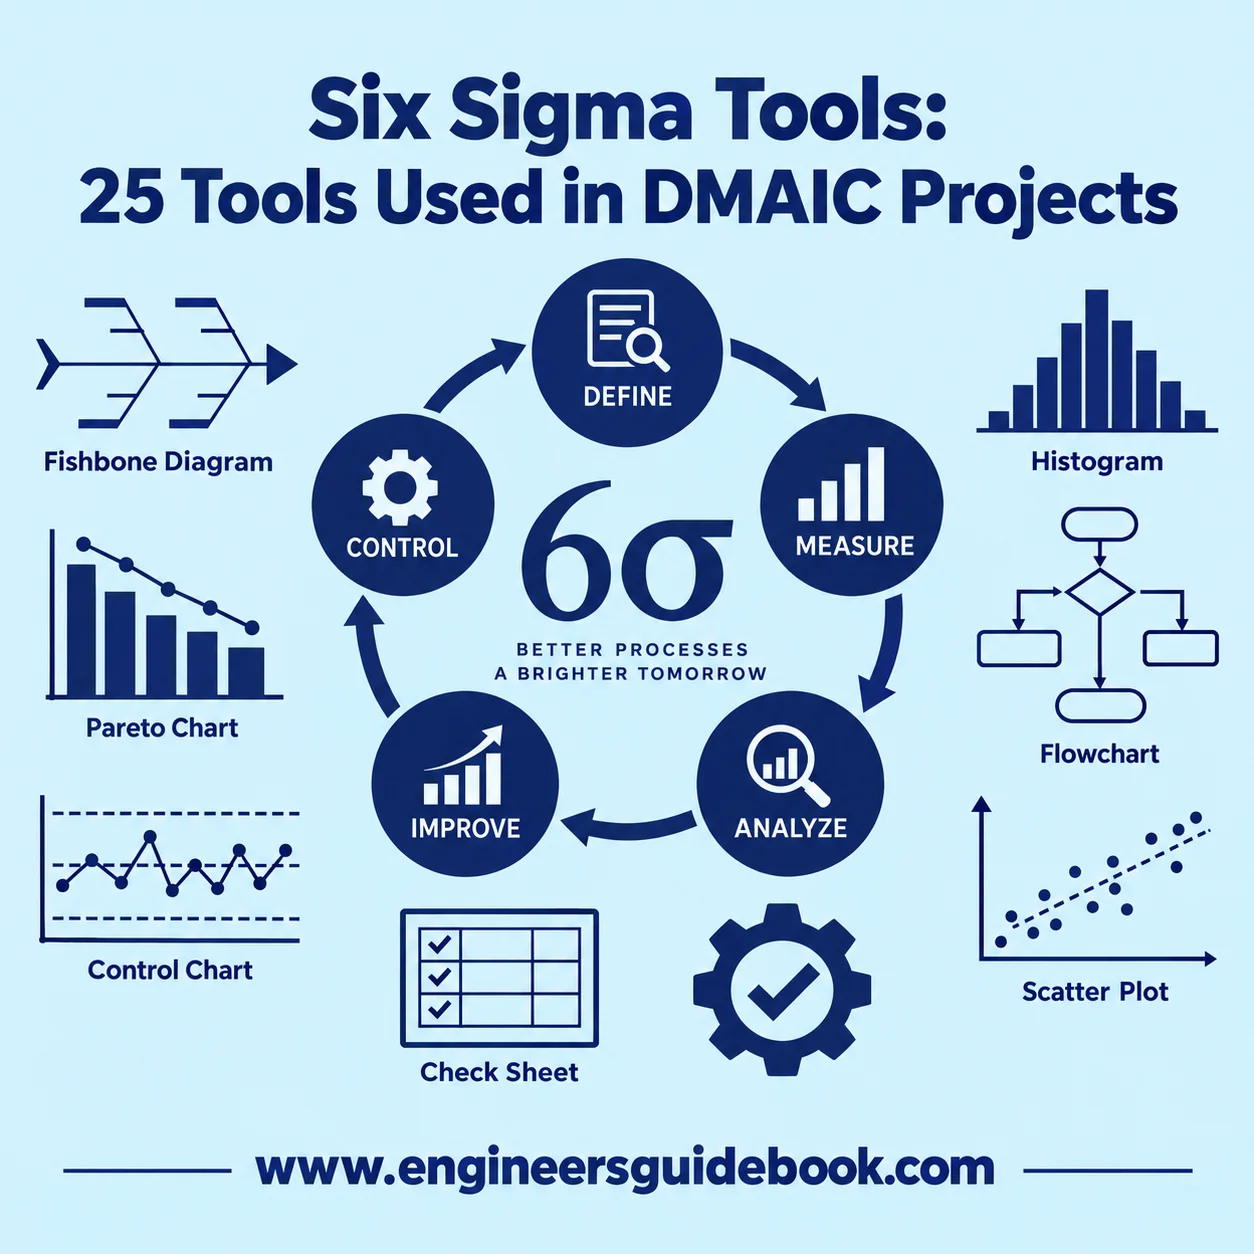
Six Sigma tools are structured methods used to define problems, measure performance, identify root causes, improve processes, and sustain results. In DMAIC projects, tools such as SIPOC, Pareto charts, fishbone diagrams, FMEA, control charts, and process capability analysis help teams replace assumptions with evidence and make systematic, data-driven improvements.
1. Six Sigma Tools Overview
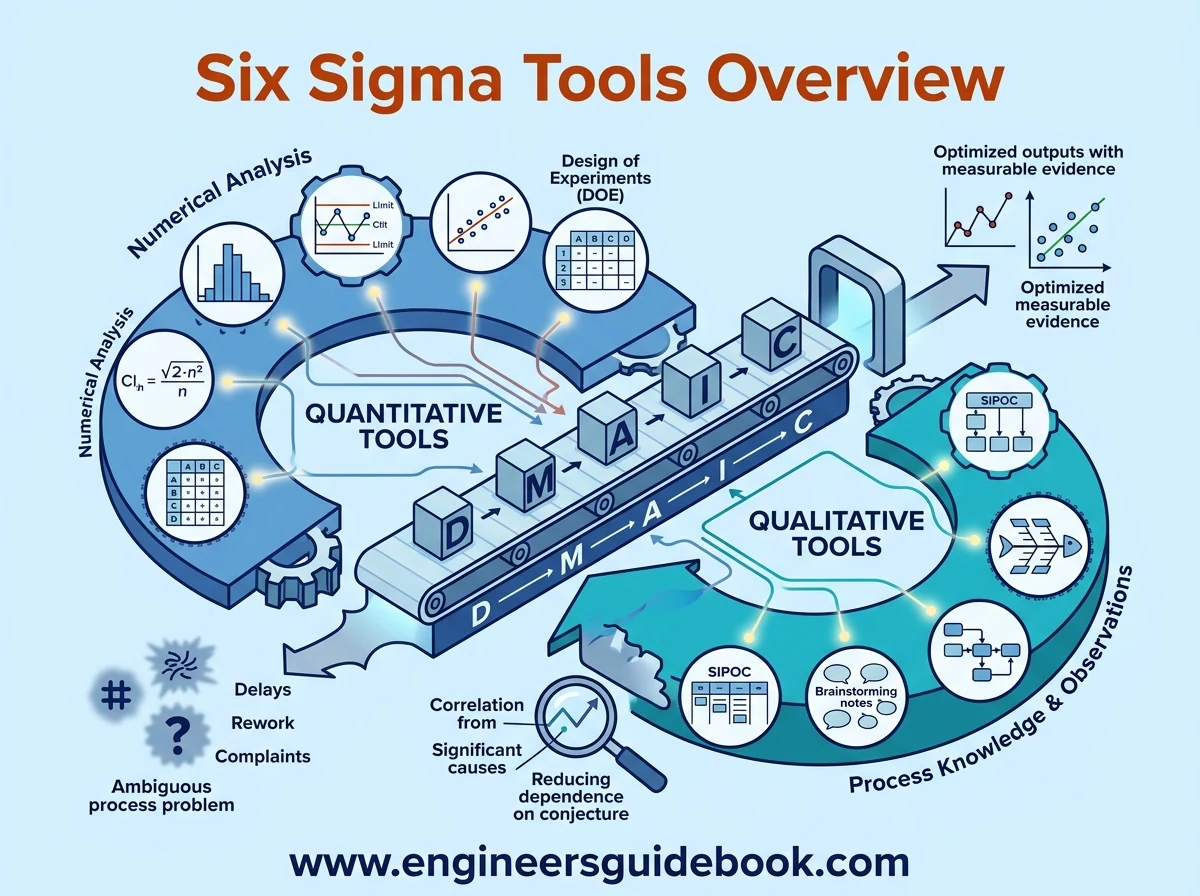
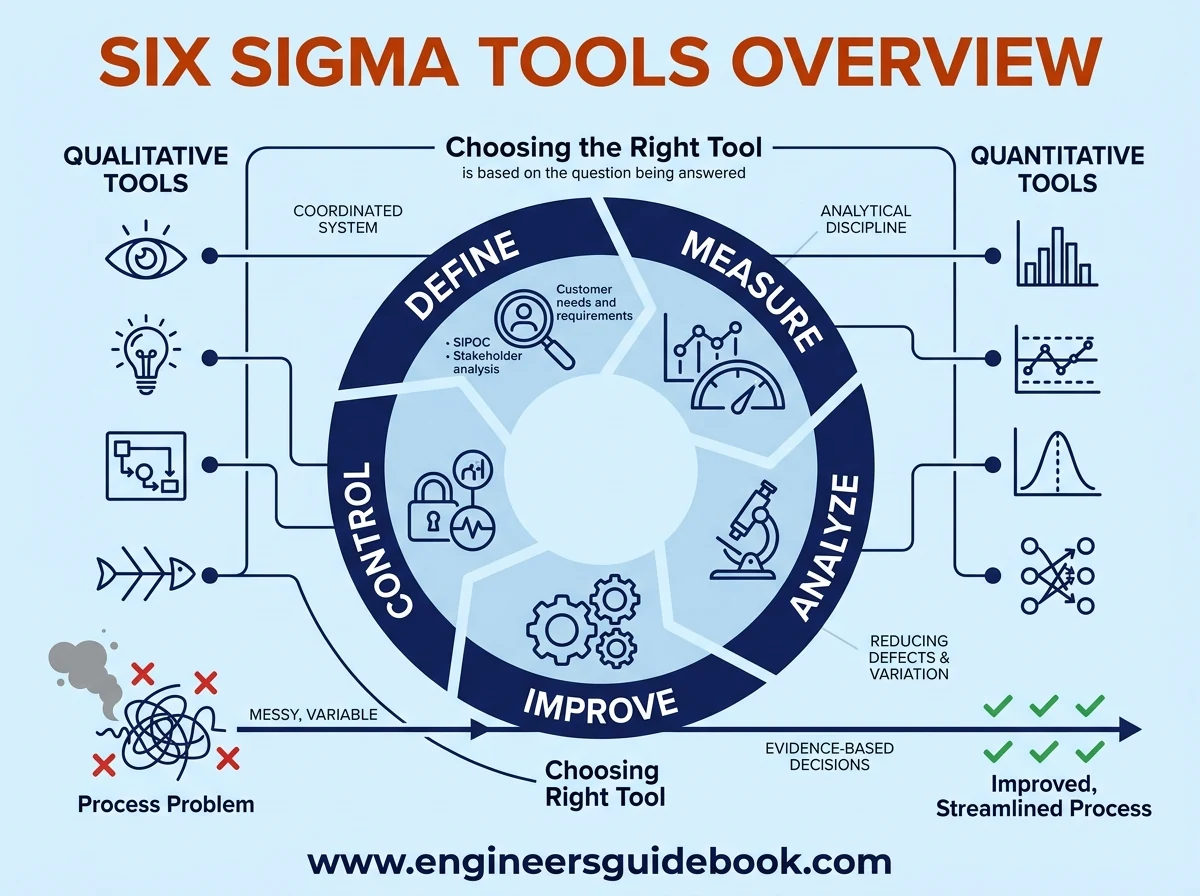
Six Sigma uses a disciplined collection of analytical, statistical, and process-improvement tools to reduce defects and variation. These tools are not isolated techniques. They form a coordinated problem-solving system that supports the five DMAIC phases of Define, Measure, Analyze, Improve, and Control.
1.1 What Six Sigma Tools Are
Six Sigma tools are techniques used to understand processes, quantify performance, expose sources of variation, evaluate risks, and verify improvements. Some are primarily graphical, such as histograms and process maps, while others rely on statistical analysis.
Their common purpose is to convert an ambiguous operational problem into measurable evidence that can guide decisions.
1.2 Why Six Sigma Tools Matter
Process problems are often obscured by symptoms. Rework, downtime, defects, complaints, delays, and excessive costs may be visible, while the mechanisms causing them remain hidden.
Six Sigma tools impose analytical discipline. They help teams distinguish correlation from causation, chronic problems from isolated incidents, and significant causes from peripheral noise. This reduces dependence on conjecture and makes improvement decisions more defensible.
1.3 How DMAIC Uses Six Sigma Tools
DMAIC provides the framework, while Six Sigma tools provide the investigative methods.
During Define, teams clarify the problem and customer requirements. Measure establishes reliable baseline data. Analyze investigates root causes. Improve develops and validates solutions. Control establishes mechanisms that prevent the process from regressing.
The tools therefore change as the project progresses because each phase answers a different question.
1.4 Quantitative and Qualitative Tools
Quantitative tools use numerical information to evaluate process behavior. Histograms, control charts, capability indices, regression analysis, and Design of Experiments are common examples.
Qualitative tools organize observations, experience, relationships, and process knowledge. SIPOC diagrams, fishbone diagrams, brainstorming, stakeholder analysis, and process maps frequently serve this purpose.
Strong DMAIC projects usually combine both. Statistical evidence reveals patterns, while qualitative investigation helps explain the operational context behind those patterns.
1.5 Choosing the Right Tool
Tool selection should begin with the problem being investigated rather than with a favorite methodology. A Pareto chart may identify dominant defect categories but cannot prove why those defects occur. A fishbone diagram can generate possible causes but does not establish statistical causation.
The most appropriate tool is the one that answers the specific question facing the project team at that point in DMAIC.
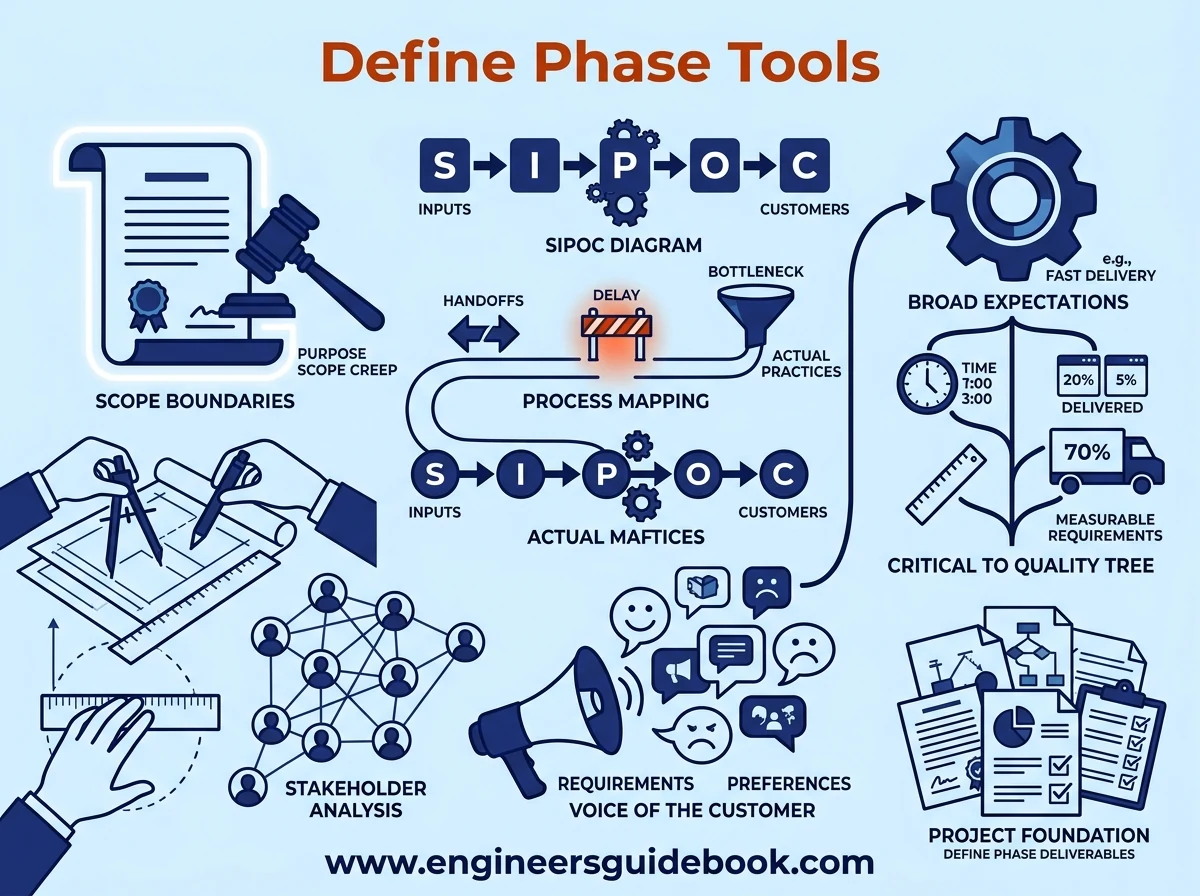
2. Define Phase Tools
The Define phase establishes the boundaries and purpose of a Six Sigma project. It prevents teams from attacking an ill-defined problem or allowing project scope to expand uncontrollably.
2.1 Project Charter
A project charter formally describes the improvement initiative. It normally identifies the business problem, project objective, scope, expected benefits, team responsibilities, timeline, and key performance measures.
A well-constructed charter creates alignment before extensive analysis begins. It also prevents scope creep by defining what the project will and will not address.
2.2 SIPOC Diagram
SIPOC stands for Suppliers, Inputs, Process, Outputs, and Customers. It provides a high-level representation of a process without becoming entangled in granular operational detail.
The diagram helps teams understand where inputs originate, how they move through the process, what outputs are created, and who receives those outputs. It is particularly valuable when participants have different perceptions of how a process actually functions.
2.3 Voice of the Customer
Voice of the Customer captures customer requirements, expectations, complaints, preferences, and perceptions. Information may come from surveys, interviews, warranty data, service records, reviews, complaint databases, or direct observation.
VOC prevents teams from defining quality exclusively from an internal perspective. Improvement priorities become connected to what customers genuinely consider important.
2.4 Critical to Quality Tree
A Critical to Quality tree transforms broad customer expectations into specific and measurable requirements.
For example, a customer request for “fast delivery” is too nebulous for rigorous analysis. A CTQ tree can translate it into measurable requirements such as dispatch time, transit duration, or percentage of orders delivered within the promised window.
This conversion makes customer expectations operationally actionable.
2.5 Stakeholder Analysis
DMAIC projects often influence several functions, departments, suppliers, or customers. Stakeholder analysis identifies the individuals and groups affected by the proposed change.
It can also assess their influence, expectations, concerns, and level of support. Understanding these dynamics early reduces resistance and improves communication throughout the project.
2.6 Process Mapping
Process mapping depicts the sequence of activities involved in producing an output. It exposes handoffs, inspection points, delays, loops, redundant approvals, and potential bottlenecks.
Even a simple map can reveal discrepancies between documented procedures and actual working practices. That distinction is important because improvement efforts must address the real process rather than an idealized version of it.
2.7 Define Phase Deliverables
Typical Define deliverables include an approved charter, problem statement, project scope, SIPOC diagram, customer requirements, CTQs, stakeholder assessment, and high-level process map.
Together, these establish a coherent project foundation before measurement begins.
Also Read Related Articles:
What is Six Sigma? Understanding the Basics
Six Sigma: Methodology, Principles, Tools, and Examples
Six Sigma Principles Explained With Examples
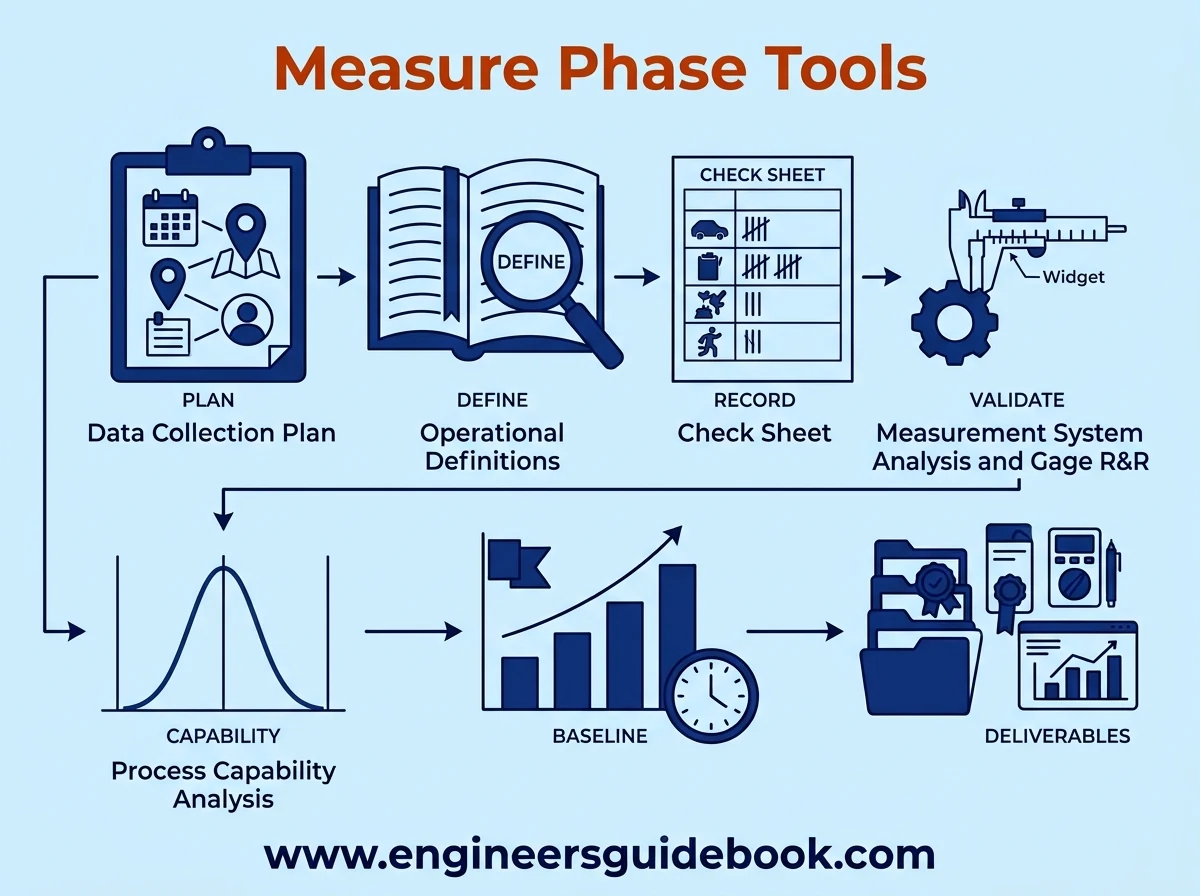
3. Measure Phase Tools
The Measure phase determines how the process currently performs. Reliable measurement is essential because inaccurate data can produce highly convincing but fundamentally erroneous conclusions.
3.1 Data Collection Plan
A data collection plan specifies what data will be collected, where it will come from, who will collect it, how frequently it will be recorded, and which sampling method will be used.
This structure prevents indiscriminate data collection and ensures that measurements relate directly to the project objective.
3.2 Operational Definitions
Operational definitions establish precise meanings for measurements and classifications.
Terms such as defect, delay, breakdown, rejection, or customer complaint can be interpreted differently by different people. A formal definition removes this ambiguity and improves consistency across observers, departments, and reporting periods.
3.3 Check Sheet
A check sheet is a standardized form used to record occurrences systematically. It can track defects, failures, locations, causes, frequencies, or other observable events.
Its simplicity is an advantage. Properly designed check sheets transform scattered observations into structured data that can later support Pareto analysis and other statistical techniques.
3.4 Measurement System Analysis
Measurement System Analysis evaluates whether the system used to collect data is sufficiently accurate and consistent.
Variation may originate from instruments, operators, procedures, environmental conditions, or measurement resolution. MSA helps determine whether observed process variation represents the process itself or deficiencies in the measurement method.
3.5 Gage R&R
Gage Repeatability and Reproducibility is a common MSA technique.
Repeatability evaluates variation when the same operator measures the same item repeatedly using the same instrument. Reproducibility examines differences between operators. Excessive measurement variation must usually be addressed before deeper process conclusions can be trusted.
3.6 Process Capability Analysis
Process capability analysis assesses whether a stable process can consistently meet specification limits.
Indices such as Cp and Cpk are commonly used to compare process spread and centering with allowable tolerances. A capable process produces output within requirements with sufficient margin, while an incapable process requires fundamental improvement.
3.7 Baseline Performance
Baseline performance establishes the starting condition against which future improvements will be compared.
Depending on the project, the baseline may include defect rate, cycle time, downtime, yield, cost, capability, throughput, or customer complaints. Without a credible baseline, claims of improvement become difficult to substantiate.
3.8 Measure Phase Deliverables
Measure deliverables typically include validated measurement methods, completed data collection, baseline metrics, process capability results, and a clearer representation of current process performance.
These outputs prepare the project for systematic root cause investigation.
4. Analyze Phase Tools
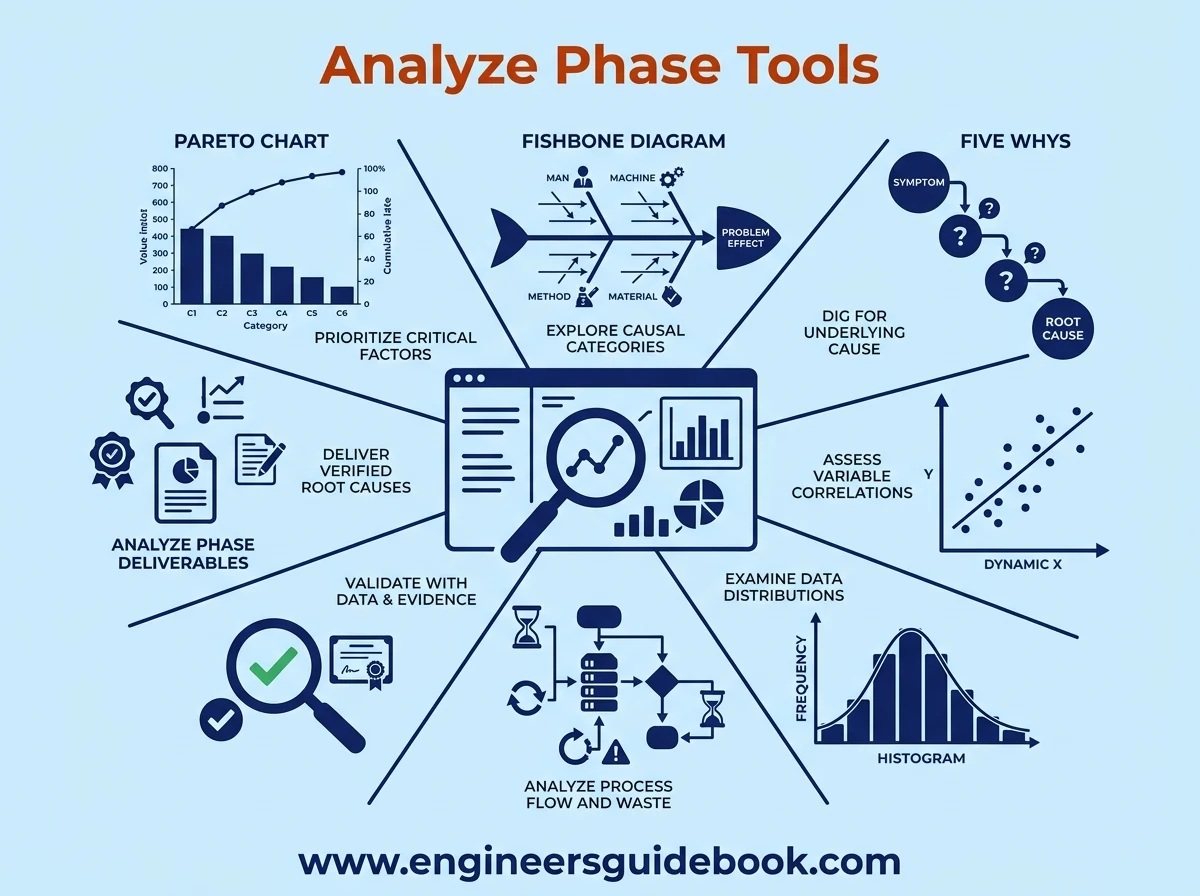
The Analyze phase seeks to determine why the problem occurs. Its central challenge is separating genuine root causes from plausible but unverified explanations.
4.1 Pareto Chart
A Pareto chart ranks categories according to frequency, cost, or another relevant measure.
It helps teams identify the relatively small number of categories contributing disproportionately to the overall problem. This concentrates analytical effort where improvement potential is greatest.
4.2 Fishbone Diagram
The fishbone diagram organizes possible causes around a defined problem or effect.
Common manufacturing categories include Man, Machine, Method, Material, Measurement, and Environment. The diagram encourages broad investigation and reduces the risk of prematurely focusing on one assumed cause.
4.3 Five Whys
The Five Whys technique repeatedly asks why an event occurred until the investigation progresses beyond the immediate symptom.
The number five is not mandatory. The objective is to follow the causal chain deeply enough to locate an actionable underlying condition rather than merely treating the latest manifestation of the problem.
4.4 Scatter Plot
A scatter plot examines the relationship between two numerical variables.
Patterns may indicate positive correlation, negative correlation, clusters, nonlinear behavior, or little apparent association. However, correlation alone does not establish causation, so additional evidence may be required.
4.5 Histogram
A histogram displays the distribution of continuous data across intervals.
Its shape can reveal spread, central tendency, skewness, multiple populations, unusual observations, and other characteristics that averages alone may conceal.
4.6 Process Analysis
Process analysis investigates how work actually flows through equipment, people, materials, information, and decision points.
Teams examine waiting, bottlenecks, unnecessary motion, rework loops, excessive inspections, and other forms of non-value-added activity. The objective is to identify mechanisms capable of producing the observed performance gap.
4.7 Root Cause Validation
A suspected cause should not be accepted merely because it appears logical.
Root cause validation uses data, experiments, stratification, hypothesis testing, controlled trials, or direct evidence to confirm whether changing a suspected factor actually affects the problem.
4.8 Analyze Phase Deliverables
The Analyze phase should conclude with verified root causes, supporting evidence, prioritized causal factors, and a clear explanation of how those factors influence process performance.
5. Improve Phase Tools
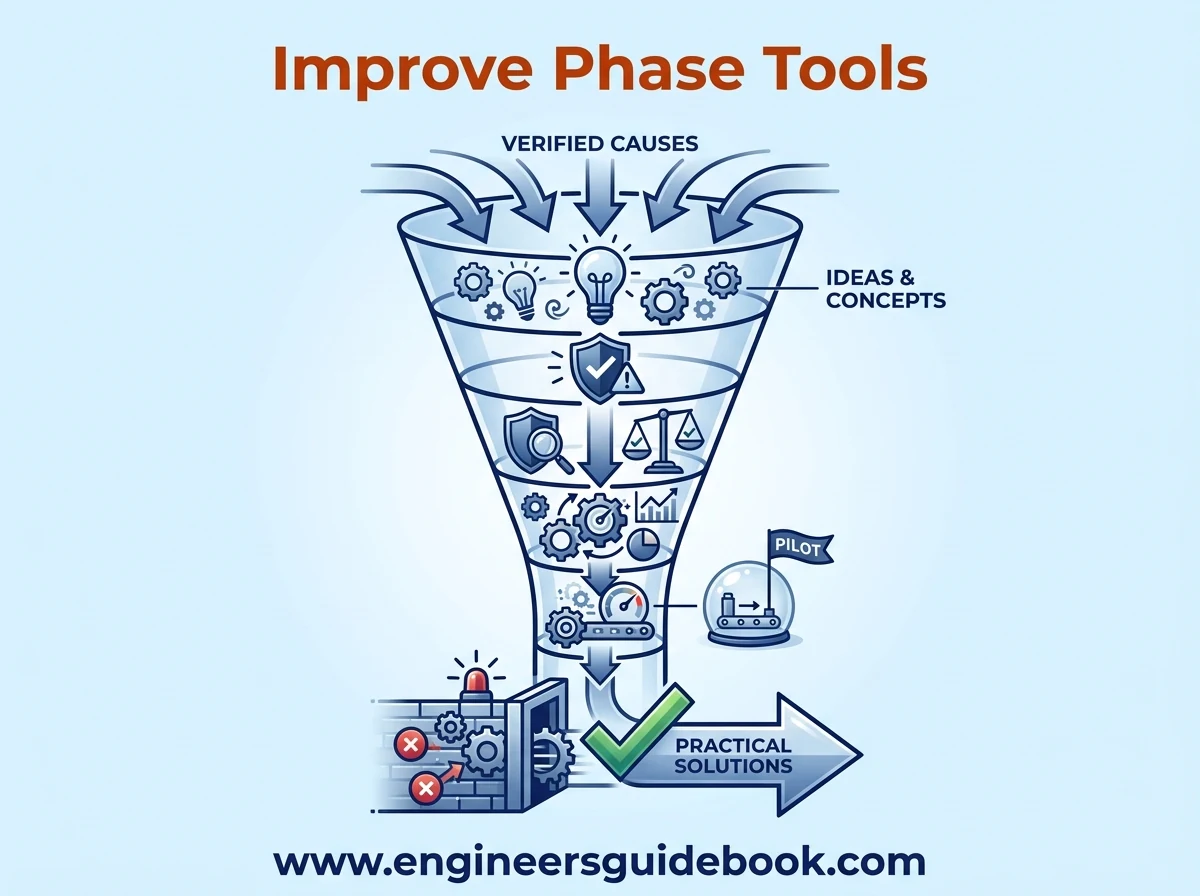
The Improve phase converts verified causes into practical solutions. The objective is not simply to generate ideas but to determine which changes produce measurable improvement with acceptable risk.
5.1 Brainstorming
Brainstorming generates alternative solutions before teams begin narrowing their options.
Effective sessions separate idea generation from evaluation. This encourages unconventional proposals and prevents promising concepts from being dismissed prematurely.
5.2 Failure Mode and Effects Analysis
FMEA evaluates potential ways a process, product, or proposed solution could fail.
Teams consider failure effects, causes, severity, occurrence, and detection controls. The method is particularly valuable before implementing changes because it encourages proactive risk mitigation.
5.3 Design of Experiments
Design of Experiments evaluates the effects of multiple process factors systematically.
Unlike changing one variable at a time, DOE can identify interactions between variables and determine combinations that optimize process performance. It is especially useful for technically complex processes.
5.4 Pugh Matrix
A Pugh Matrix compares alternative solutions against defined evaluation criteria.
Options may be assessed against factors such as effectiveness, cost, implementation difficulty, safety, reliability, and customer impact. The method adds structure to decisions that might otherwise become subjective.
5.5 Solution Prioritization Matrix
A solution prioritization matrix ranks improvement ideas according to weighted criteria.
High-impact, feasible, and lower-risk options can therefore be distinguished from attractive but impractical proposals.
5.6 Pilot Testing
Pilot testing introduces a proposed solution on a controlled scale before full implementation.
A pilot allows teams to verify expected benefits, uncover unintended consequences, gather operator feedback, and adjust implementation details with comparatively limited exposure.
5.7 Mistake Proofing
Mistake proofing, or Poka Yoke, modifies processes so errors become difficult or impossible to make.
Examples include keyed components, sensors, fixtures, interlocks, alarms, and automatic verification systems. Preventing an error is generally more robust than detecting it after it has occurred.
5.8 Improve Phase Deliverables
Improve deliverables typically include selected solutions, risk assessments, pilot results, validated performance gains, revised process designs, and implementation plans.
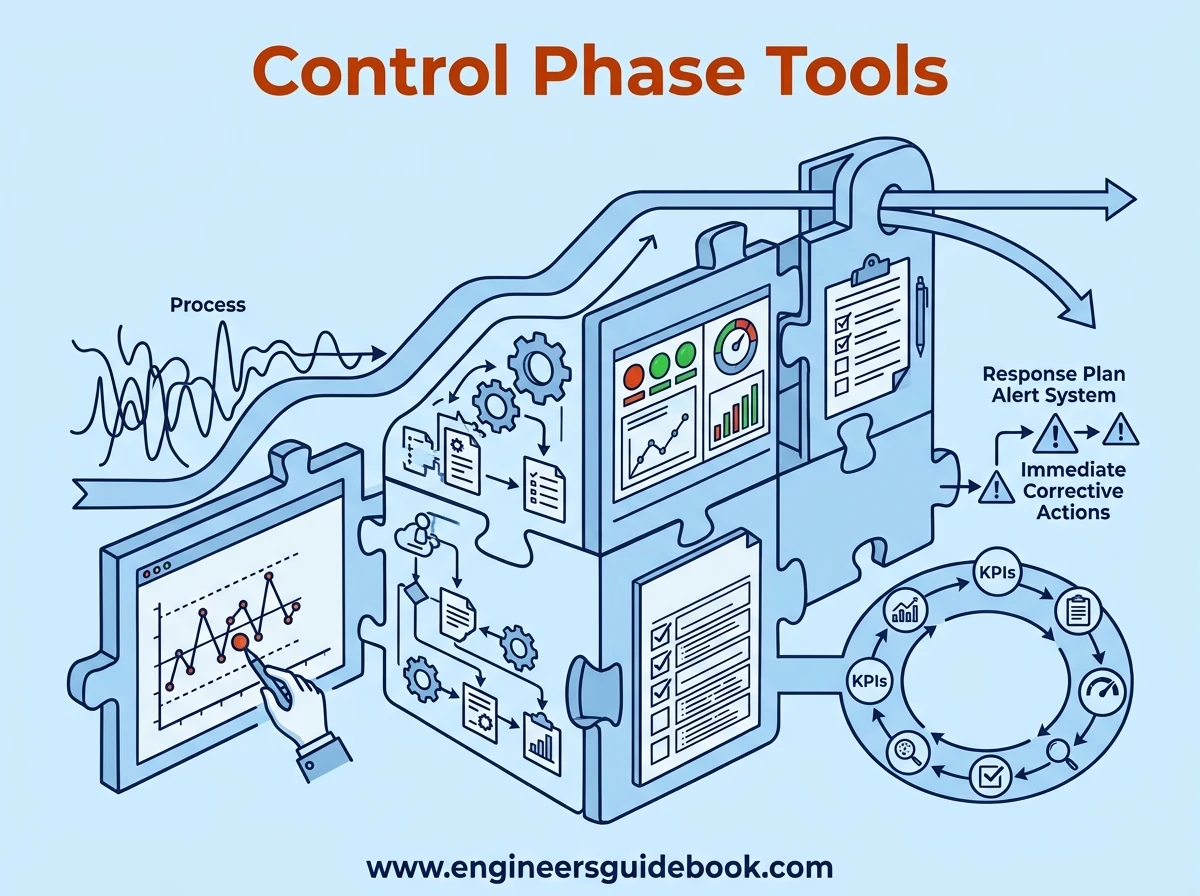
6. Control Phase Tools
The Control phase protects the gains achieved during improvement. Without sustained monitoring and standardized practices, processes can gradually drift back toward their previous condition.
6.1 Control Chart
A control chart tracks process performance over time and distinguishes common-cause variation from unusual signals.
Control limits provide a statistical basis for recognizing process changes that warrant investigation.
6.2 Control Plan
A control plan documents what must be monitored after implementation.
It normally identifies critical variables, specifications, measurement methods, monitoring frequency, responsibilities, and actions required when performance deviates from expectations.
6.3 Standard Operating Procedures
Standard Operating Procedures formalize the improved method.
Clear SOPs reduce variation in how tasks are performed and provide a consistent reference for training, auditing, and daily execution.
6.4 Visual Management
Visual management makes process status immediately recognizable through displays, labels, markings, dashboards, boards, and status indicators.
Effective visual controls reduce interpretation time and allow abnormal conditions to become conspicuous.
6.5 Statistical Process Control
Statistical Process Control uses statistical techniques to monitor process stability and variation over time.
SPC helps organizations respond to meaningful process signals without overreacting to normal random fluctuation.
6.6 Response Plan
A response plan defines what should happen when a monitored variable exceeds limits or displays abnormal behavior.
Responsibilities, escalation routes, containment actions, and corrective steps should be predetermined so deviations are addressed rapidly.
6.7 Process Monitoring
Long-term monitoring confirms whether the improved process continues to achieve expected results.
KPIs, audits, control charts, dashboards, defect tracking, and periodic capability assessments may all contribute to this surveillance.
6.8 Control Phase Deliverables
Control deliverables generally include control plans, revised SOPs, monitoring systems, response procedures, ownership transfer, training records, and evidence that improvements remain sustainable.
7. Process Mapping Tools
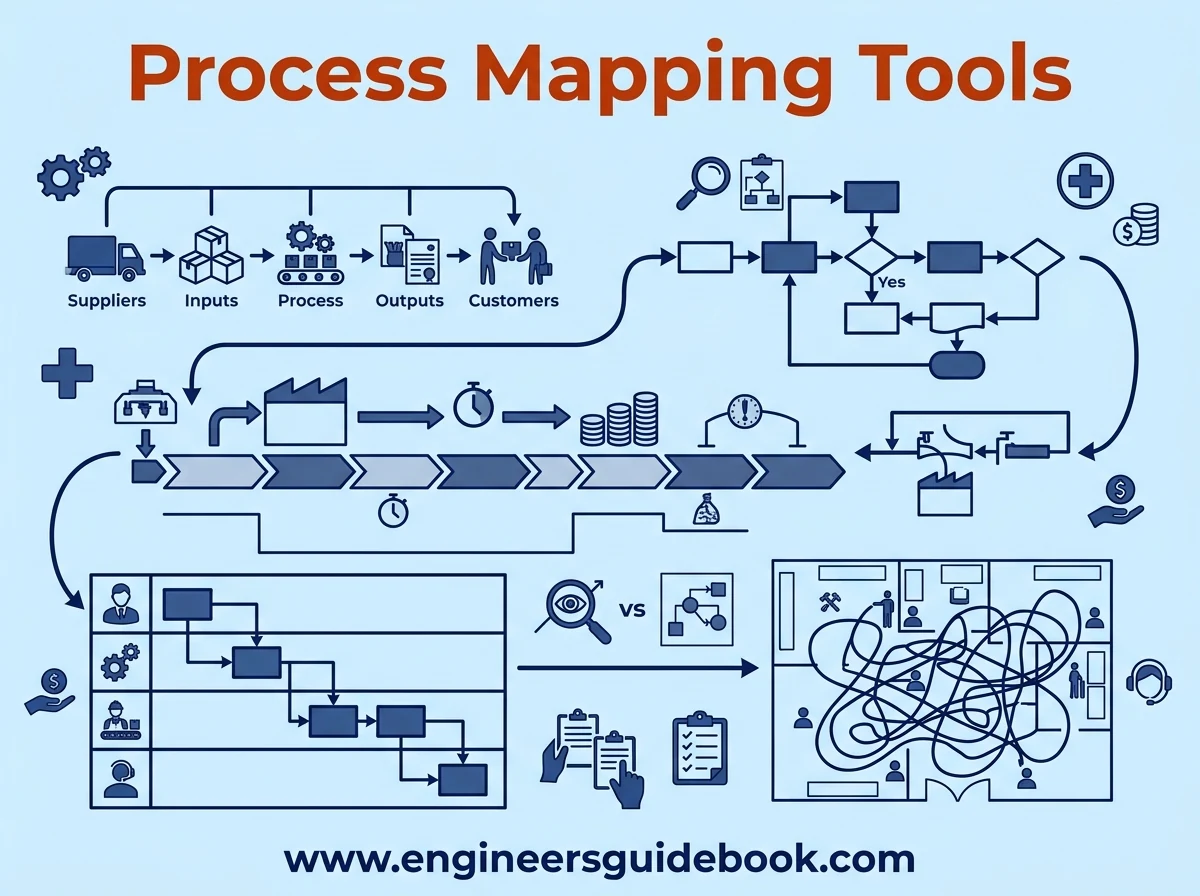
Process mapping tools provide different levels of visibility into how work, information, material, and decisions move through a system.
7.1 SIPOC
SIPOC provides the broadest process perspective. It is useful early in DMAIC when teams need to establish process boundaries and understand relationships between suppliers, inputs, outputs, and customers.
7.2 Flowchart
A flowchart represents activities and decisions sequentially.
It is useful for identifying loops, unnecessary steps, duplicated work, decision complexity, and areas where a process departs from its intended sequence.
7.3 Value Stream Map
A Value Stream Map examines material and information flow from a broader end-to-end perspective.
It distinguishes value-added activities from delays and waste while highlighting lead time, inventory, processing time, and bottlenecks.
7.4 Swimlane Diagram
A swimlane diagram divides process activities according to departments, functions, roles, or individuals.
This makes handoffs and ownership particularly visible. It can reveal fragmented responsibilities, approval congestion, and communication gaps.
7.5 Spaghetti Diagram
A spaghetti diagram traces the physical movement of people, materials, or equipment through a workspace.
Excessive crossing, backtracking, and travel distance can expose inefficient layouts that increase handling time, fatigue, congestion, and transportation waste.
7.6 Process Mapping Applications
Process maps can support manufacturing, maintenance, logistics, healthcare, finance, customer service, procurement, and administrative processes.
Their value lies in transforming an invisible workflow into a structure that teams can inspect, question, measure, and redesign.
7.7 Process Mapping Best Practices
Maps should represent actual process behavior rather than assumptions about how work is supposed to occur. Direct observation and input from employees performing the work improve accuracy.
The level of detail should also match the analytical purpose. Excessive granularity creates clutter, while insufficient detail can conceal the very inefficiencies the project is attempting to uncover.
8. Root Cause Analysis Tools
Root cause analysis tools help Six Sigma teams move beyond visible symptoms and identify the mechanisms that actually create a problem. This stage requires disciplined inquiry because an apparent cause may only be another consequence of a deeper process deficiency.
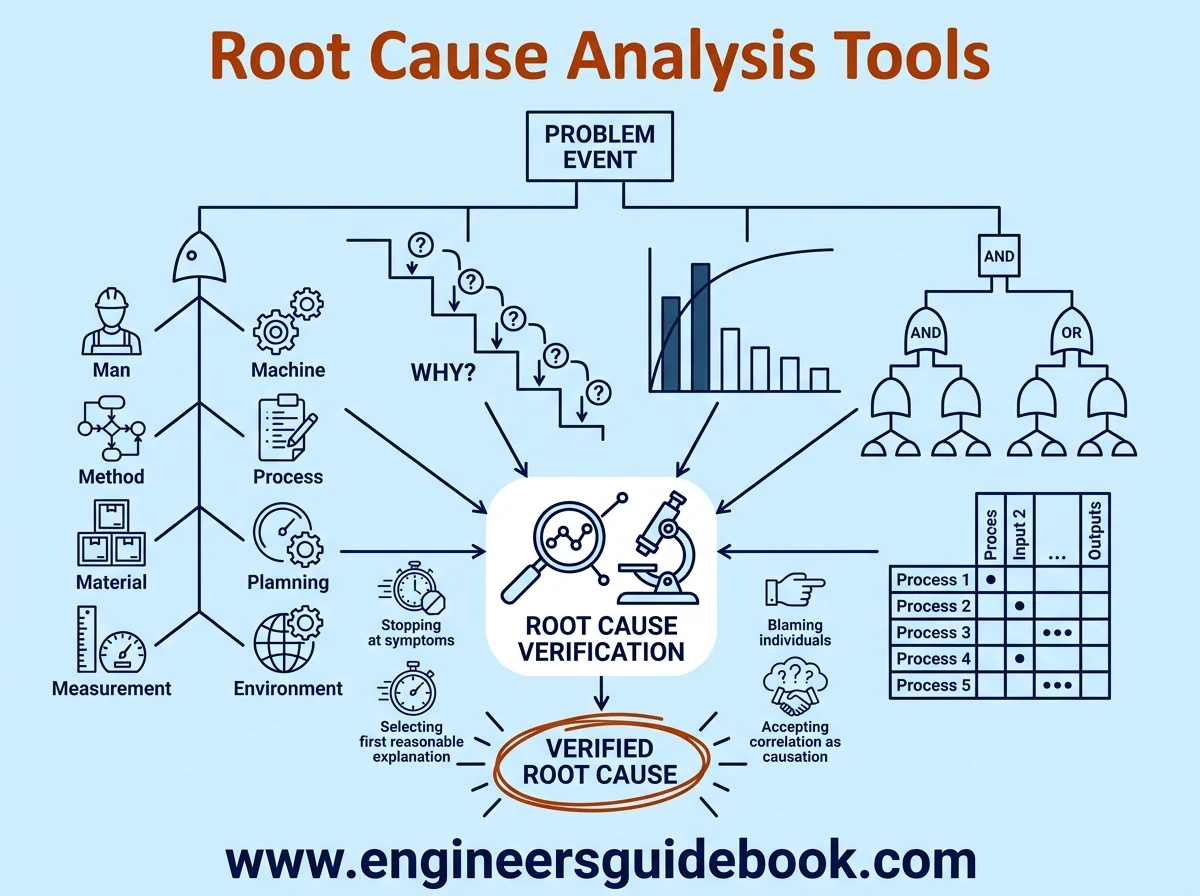
8.1 Fishbone Diagram
A fishbone diagram organizes potential causes of a problem into logical categories. Typical manufacturing categories include Man, Machine, Method, Material, Measurement, and Environment.
Its value lies in breadth. Instead of focusing prematurely on one explanation, the team systematically explores multiple causal pathways. The resulting hypotheses should later be validated with evidence rather than accepted solely because they appear plausible.
8.2 Five Whys
The Five Whys technique investigates causation by repeatedly asking why an event occurred.
A machine stoppage, for example, may initially be attributed to bearing failure. Asking why the bearing failed could reveal inadequate lubrication, an incorrect maintenance interval, or a deficient inspection procedure.
The technique is simple but powerful when supported by facts. It becomes unreliable when teams answer each “why” with assumptions rather than observations.
8.3 Pareto Analysis
Pareto analysis helps teams prioritize the categories contributing most significantly to a problem.
Defects, failures, complaints, or downtime events are ranked by frequency, cost, duration, or another meaningful metric. This often reveals that a relatively small number of categories account for a disproportionate share of losses.
The method narrows the investigation and directs resources toward the most consequential areas.
8.4 Fault Tree Analysis
Fault Tree Analysis is a deductive method that begins with an undesirable event and works backward through combinations of potential causes.
Logical relationships such as AND and OR conditions are used to show how different failures can combine. FTA is particularly valuable in complex systems where several mechanical, electrical, procedural, or human factors may interact.
8.5 Cause and Effect Matrix
A Cause and Effect Matrix links process inputs to critical customer or process outputs.
Inputs are evaluated according to how strongly they influence important outcomes. This allows teams to rank potential process variables and identify which ones deserve deeper measurement and analysis.
It is especially useful when many possible inputs exist and investigative resources are limited.
8.6 Root Cause Verification
Root cause verification confirms whether an identified factor actually contributes to the observed problem.
Verification may involve stratified data, controlled trials, statistical tests, repeated observation, or experiments. A genuine root cause should produce a predictable change in the outcome when the causal factor is altered.
Without verification, root cause analysis remains conjectural.
8.7 Common Root Cause Analysis Mistakes
Common mistakes include stopping at symptoms, relying excessively on experience, accepting correlation as causation, blaming individuals, and failing to verify conclusions.
Another frequent error is selecting the first reasonable explanation. Effective Six Sigma analysis remains skeptical until evidence establishes a credible causal relationship.
9. Statistical Analysis Tools
Statistical tools transform process data into evidence. They help teams understand variation, compare groups, detect relationships, and determine whether observed changes are likely to be meaningful.
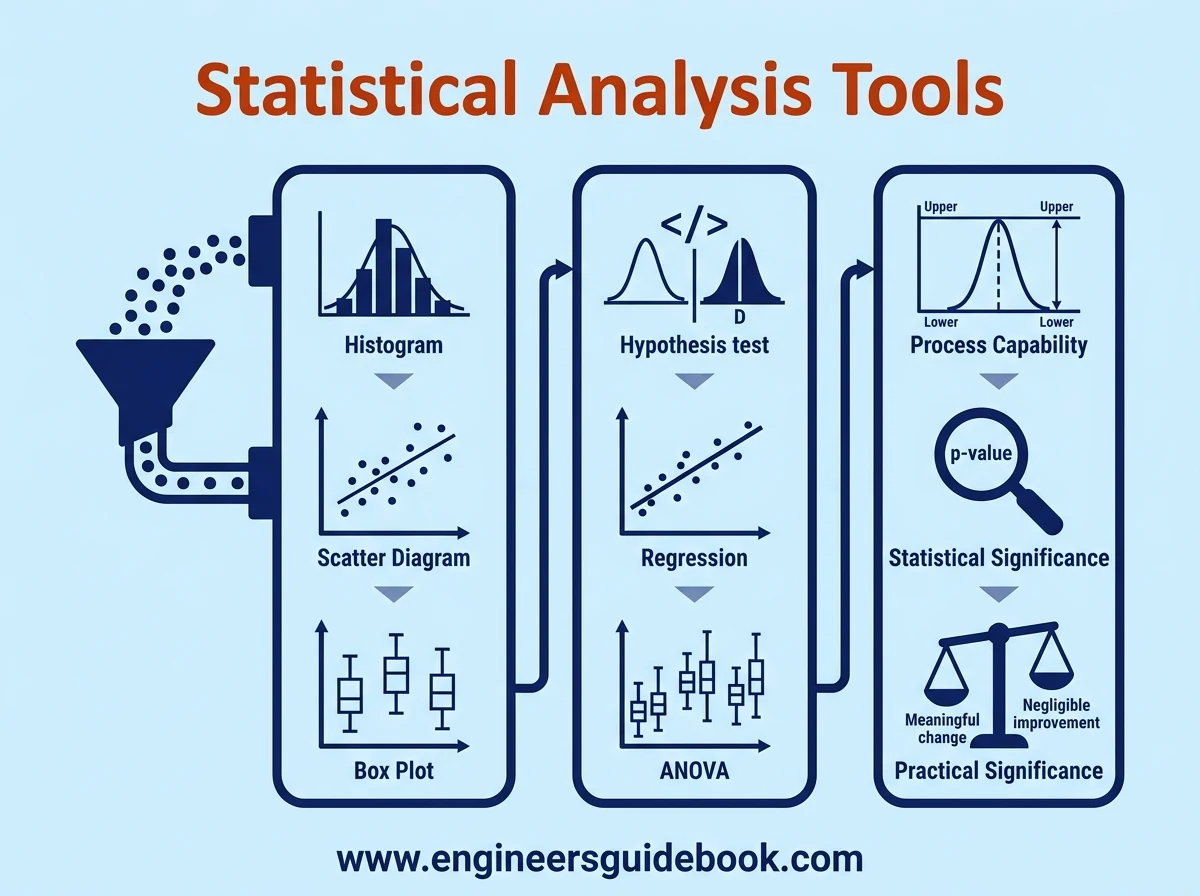
9.1 Histogram
A histogram displays the frequency distribution of continuous data.
Its shape can reveal central tendency, spread, skewness, multiple populations, and unusual observations. This makes it useful for evaluating cycle time, dimensional measurements, process temperatures, fill weights, and other numerical characteristics.
9.2 Scatter Diagram
A scatter diagram plots one numerical variable against another.
It helps visualize whether two variables move together, move in opposite directions, or show little apparent association. Patterns may suggest further investigation, although a visible relationship alone does not prove causality.
9.3 Box Plot
A box plot summarizes a distribution using the median, quartiles, spread, and potential outliers.
It is particularly useful for comparing multiple groups simultaneously. Different machines, shifts, suppliers, materials, or operators can be compared without displaying every individual observation.
9.4 Hypothesis Testing
Hypothesis testing evaluates whether an observed difference or relationship is statistically credible.
A team might test whether two production lines have different defect rates or whether a process change altered average cycle time. The method provides a formal framework for distinguishing genuine effects from random variation.
9.5 Regression Analysis
Regression analysis quantifies relationships between an output and one or more input variables.
It can help determine how strongly factors such as temperature, pressure, speed, or material composition affect process performance. Regression is also useful for prediction when the underlying relationship is sufficiently stable.
9.6 Analysis of Variance
Analysis of Variance, commonly called ANOVA, compares the means of several groups.
Instead of performing numerous pairwise tests, ANOVA determines whether meaningful differences exist somewhere among the groups. Applications include comparing machines, operators, suppliers, process settings, or production methods.
9.7 Process Capability
Process capability evaluates whether a stable process can consistently produce output within specification limits.
Metrics such as Cp and Cpk compare natural process variation with customer or engineering tolerances. Capability analysis should generally be performed only after process stability has been established.
9.8 Statistical Significance
Statistical significance indicates whether an observed effect is unlikely to have occurred through random sampling variation alone.
It is useful for formal inference, but it should not be interpreted as proof that an effect is operationally important.
9.9 Practical Significance
Practical significance considers whether an observed improvement is large enough to matter in real operations.
A statistically significant reduction of a few seconds may be irrelevant if it produces no meaningful improvement in capacity, cost, quality, safety, or customer satisfaction. Six Sigma decisions should consider both statistical and practical consequences.
10. Risk and Improvement Tools
Risk and improvement tools help teams convert verified root causes into solutions that are effective, feasible, and sustainable.
10.1 Failure Mode and Effects Analysis
Failure Mode and Effects Analysis systematically identifies potential failures before they occur.
Teams evaluate possible failure modes, their effects, causes, existing controls, and relative risk. FMEA is especially useful when implementing a new process or changing an existing one.
10.2 Design of Experiments
Design of Experiments evaluates several process factors in a controlled and structured manner.
DOE can identify significant factors, interactions, and optimal operating combinations. It is considerably more efficient than changing one parameter at a time when multiple variables influence the outcome.
10.3 Poka Yoke
Poka Yoke refers to mistake-proofing techniques that prevent errors or make them immediately detectable.
Fixtures, sensors, interlocks, keyed components, software validation, and physical guides are common examples. The best mistake-proofing solutions remove dependence on memory and vigilance.
10.4 Prioritization Matrix
A prioritization matrix compares proposed solutions against defined criteria.
Effectiveness, implementation cost, risk, complexity, customer impact, and time requirements can be weighted according to their importance. The method turns a subjective selection process into a more transparent decision framework.
10.5 Cost Benefit Analysis
Cost Benefit Analysis compares the expected financial value of an improvement with the cost of implementing it.
Costs may include equipment, labor, training, downtime, and maintenance. Benefits can include waste reduction, higher throughput, lower defect rates, energy savings, and avoided failures.
10.6 Pilot Plan
A pilot plan defines how a solution will be tested before wider deployment.
It specifies the test scope, duration, responsible personnel, success criteria, required measurements, and contingency actions. Piloting reduces implementation risk and provides evidence before substantial resources are committed.
10.7 Risk Reduction
Risk reduction focuses on decreasing the probability or consequence of undesirable events.
Effective controls may eliminate the hazard, redesign the process, introduce detection mechanisms, improve maintenance, or establish stronger procedural safeguards.
10.8 Solution Validation
Solution validation confirms that an implemented improvement actually produces the intended result.
Teams compare post-improvement performance with the original baseline and verify that the change has not created unacceptable secondary effects.
11. Six Sigma Tools Selection
Choosing the correct tool is as important as using the tool correctly. The analytical question should determine the method.
11.1 Tools for Problem Definition
Project charters, SIPOC diagrams, process maps, and stakeholder analysis are useful when the problem needs clearer boundaries and context.
11.2 Tools for Customer Requirements
Voice of the Customer and Critical to Quality analysis translate customer expectations into measurable process requirements.
11.3 Tools for Data Collection
Check sheets, sampling plans, operational definitions, and data collection plans improve consistency and traceability.
11.4 Tools for Process Measurement
Measurement System Analysis, Gage R&R, capability analysis, and baseline metrics determine whether current performance is measured reliably.
11.5 Tools for Root Cause Analysis
Fishbone diagrams, Five Whys, Pareto analysis, scatter plots, and hypothesis testing help teams investigate and validate causal factors.
11.6 Tools for Solution Development
Brainstorming, DOE, prioritization matrices, Pugh matrices, and pilot testing support solution generation and selection.
11.7 Tools for Risk Management
FMEA, fault trees, risk matrices, and mistake-proofing methods help anticipate and mitigate potential failures.
11.8 Tools for Process Control
Control charts, control plans, SOPs, dashboards, and response plans help sustain improved performance.
11.9 Tool Selection by DMAIC Phase
Define tools clarify the project. Measure tools establish reliable data. Analyze tools identify causes. Improve tools develop solutions. Control tools preserve results.
The phase provides direction, but the specific business question should remain the primary selection criterion.
11.10 Avoiding Tool Overuse
Using more tools does not automatically produce a better Six Sigma project.
Unnecessary analysis can consume time, complicate communication, and obscure the central problem. Teams should use the smallest set of tools necessary to generate reliable evidence and support a sound decision.
12. Six Sigma Tools FAQ
12.1 What Are the Most Common Six Sigma Tools
Common Six Sigma tools include SIPOC, process maps, Pareto charts, fishbone diagrams, Five Whys, histograms, control charts, FMEA, capability analysis, and Design of Experiments.
12.2 What Tools Are Used in DMAIC
DMAIC uses different tools in each phase, including project charters in Define, MSA in Measure, root cause tools in Analyze, DOE in Improve, and control charts in Control.
12.3 Which Six Sigma Tools Are Used in the Define Phase
Typical Define tools include project charters, SIPOC diagrams, Voice of the Customer, CTQ trees, stakeholder analysis, and process maps.
12.4 Which Six Sigma Tools Are Used in the Measure Phase
Common Measure tools include data collection plans, operational definitions, check sheets, MSA, Gage R&R, and capability analysis.
12.5 Which Six Sigma Tools Are Used in the Analyze Phase
Analyze commonly uses Pareto charts, fishbone diagrams, Five Whys, scatter plots, histograms, regression, and hypothesis testing.
12.6 Which Six Sigma Tools Are Used in the Improve Phase
Improve tools include brainstorming, FMEA, Design of Experiments, prioritization matrices, Pugh matrices, pilot testing, and Poka Yoke.
12.7 Which Six Sigma Tools Are Used in the Control Phase
Control tools include control charts, control plans, SOPs, visual management, SPC, response plans, and performance monitoring.
12.8 What Is the Most Important Six Sigma Tool
There is no single universally superior tool. The most useful tool depends on the process problem, available data, DMAIC phase, and decision being made.
12.9 What Is SIPOC in Six Sigma
SIPOC is a high-level process mapping tool showing Suppliers, Inputs, Process, Outputs, and Customers.
12.10 What Is FMEA in Six Sigma
FMEA is a structured risk analysis method used to identify potential failure modes, their effects, causes, and existing controls.
12.11 What Is the Difference Between Pareto Chart and Fishbone Diagram
A Pareto chart prioritizes major problem categories using data, while a fishbone diagram organizes potential causes that may explain the problem.
12.12 What Statistical Tools Are Used in Six Sigma
Common statistical tools include histograms, control charts, regression, hypothesis testing, ANOVA, box plots, capability analysis, and DOE.
12.13 How Do You Choose the Right Six Sigma Tool
Start with the question that needs to be answered, then select the simplest tool capable of producing reliable evidence for that question.
12.14 Can Six Sigma Tools Be Used Without Six Sigma Certification
Yes. Many Six Sigma tools can be applied without formal certification, provided users understand their assumptions, limitations, and correct application.
13. Conclusion
Six Sigma tools provide a structured means of defining problems, measuring processes, identifying causes, evaluating solutions, and maintaining improvement.
The most effective DMAIC projects match each analytical tool to a specific question rather than applying methods mechanically.
Data-driven problem solving replaces supposition with evidence. This improves the credibility of decisions and reduces the likelihood of treating symptoms instead of causes.
Six Sigma is most valuable when its tools become part of routine operational thinking. Repeated measurement, analysis, experimentation, and control create a disciplined cycle in which processes are continually refined rather than improved only after major problems appear.