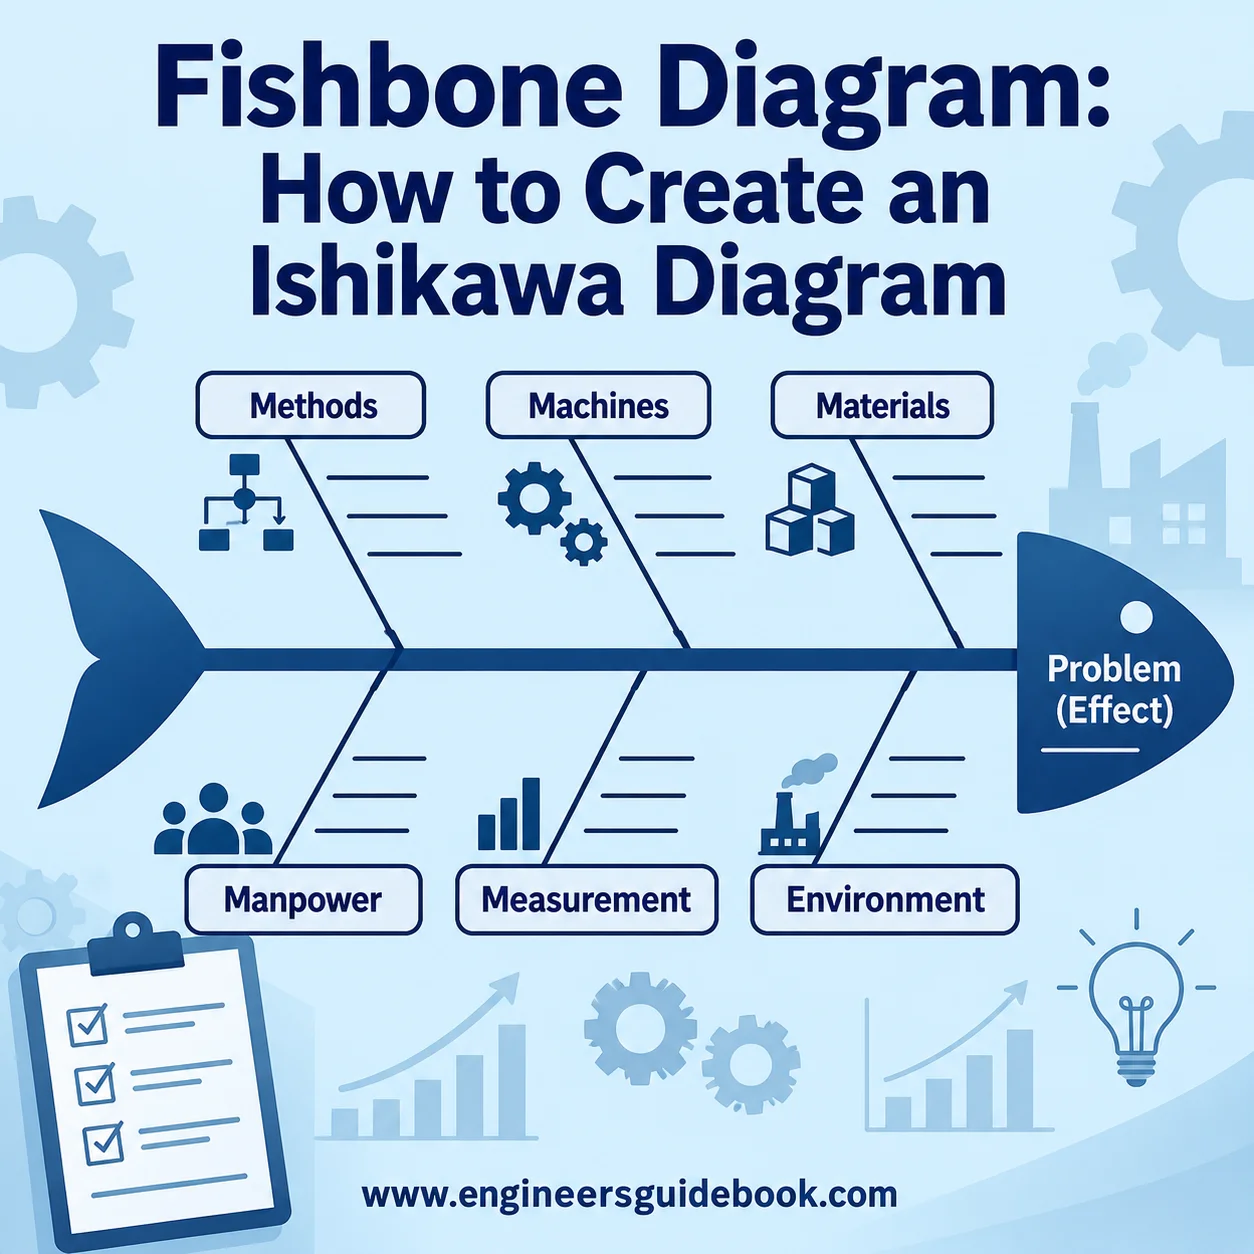
A fishbone diagram, also called an Ishikawa or cause-and-effect diagram, is a structured root cause analysis tool used to identify, organize, and investigate possible causes of a specific problem. By arranging causes into logical categories and tracing them toward the observed effect, teams can move beyond symptoms, uncover contributing factors, validate likely root causes, and develop more effective corrective actions.
1. Fishbone Diagram
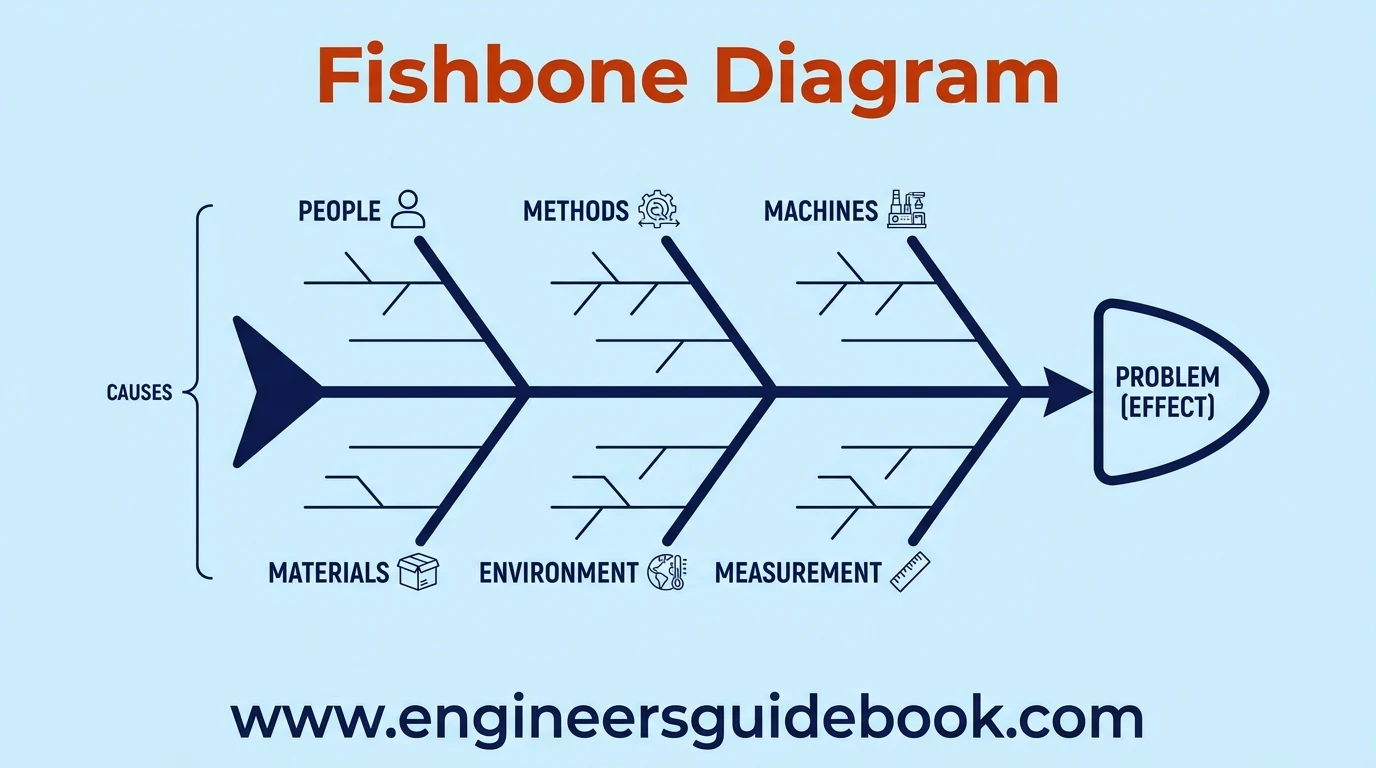
A fishbone diagram provides a visual framework for investigating why a problem occurs. Its distinctive shape resembles the skeleton of a fish, with a central spine leading toward the problem and angled branches representing categories of possible causes. Rather than jumping to conclusions, teams systematically examine multiple dimensions of a problem before deciding where corrective action should be focused.
The technique is particularly valuable when a failure, defect, delay, safety event, or quality deviation may have several interacting causes. It encourages structured thinking and reduces the tendency to blame the most visible factor.
1.1 Fishbone Diagram Definition
A fishbone diagram is a graphical root cause analysis method that organizes potential causes of a defined problem into major categories and progressively smaller contributing factors. The problem, often called the effect, is placed at the head of the diagram.
Main cause categories form the large bones. Secondary and tertiary causes branch from them. This hierarchical arrangement makes complex problems easier to examine while exposing relationships that may otherwise remain hidden during ordinary discussion.
1.2 Ishikawa Diagram Meaning
The term Ishikawa diagram comes from Japanese quality expert Kaoru Ishikawa, who helped popularize the method in industrial quality management. For this reason, fishbone diagram, Ishikawa diagram, and cause-and-effect diagram are commonly used interchangeably.
The method reflects an important quality philosophy: undesirable outcomes are rarely random. They usually emerge from identifiable combinations of processes, equipment, people, materials, methods, and surrounding conditions.
1.3 Cause and Effect Analysis
Cause and effect analysis examines the relationship between an observed problem and the conditions capable of producing it. The effect is the measurable issue, such as excessive downtime, product leakage, dimensional variation, customer complaints, or delayed delivery.
The fishbone structure helps separate speculation from structured investigation. Teams generate possible causes first, then verify them through data, inspection, testing, interviews, records, and process observation. The diagram therefore acts as an analytical map rather than proof of causation by itself.
1.4 Fishbone Diagram Purpose
The primary purpose of a fishbone diagram is to broaden root cause investigation while keeping it organized. Instead of focusing immediately on one suspected cause, the team explores several plausible causal pathways.
It is also useful for facilitating cross-functional discussions, exposing knowledge gaps, documenting brainstorming sessions, identifying areas requiring data collection, and creating a common understanding of the problem. When used correctly, it turns an amorphous issue into a tractable investigation.
2. Fishbone Diagram History
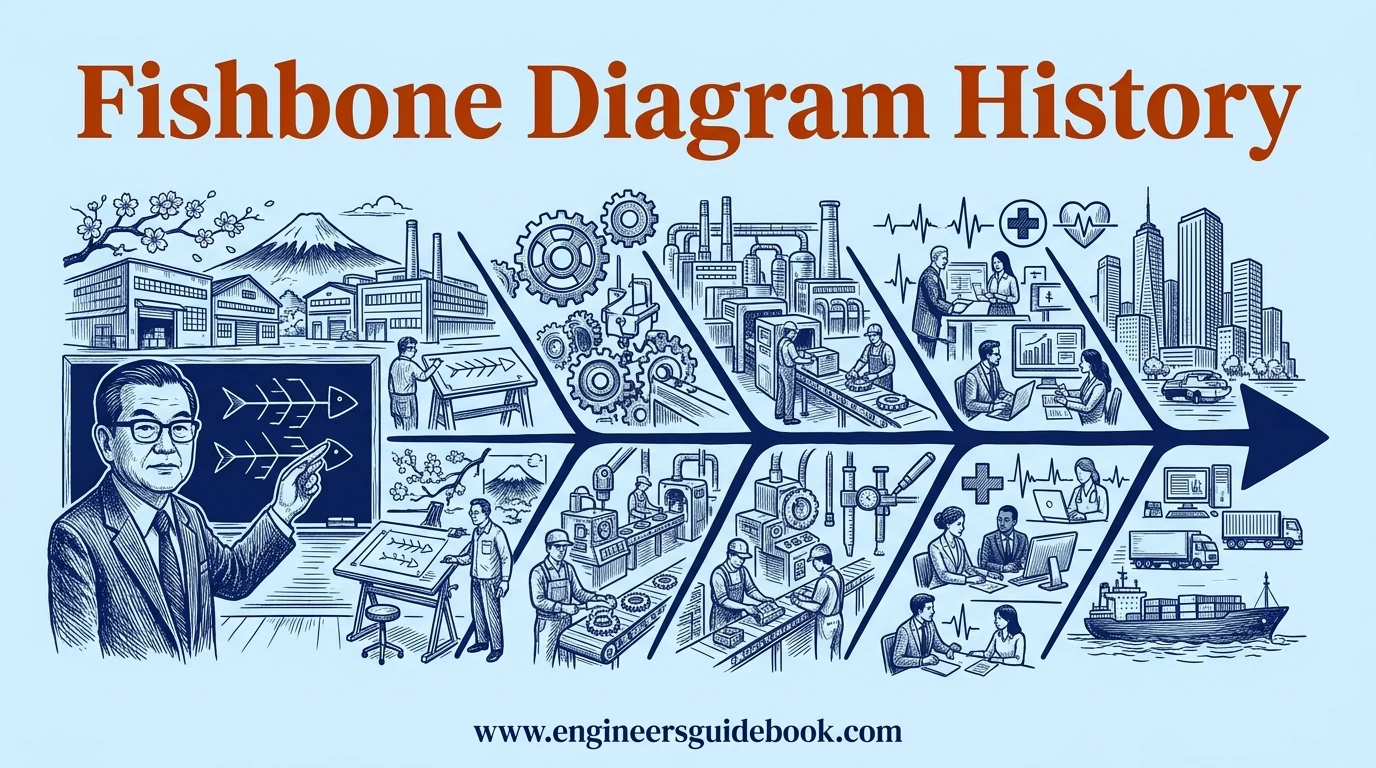
The fishbone diagram developed within the broader evolution of modern quality management. Its roots are closely associated with post-war Japanese manufacturing, where companies increasingly adopted systematic methods for controlling variation, improving processes, and involving employees in continuous improvement.
2.1 Kaoru Ishikawa
Kaoru Ishikawa was a prominent Japanese organizational theorist and quality management specialist. He promoted practical quality tools that could be understood and used not only by statistical experts but also by supervisors, engineers, technicians, and production workers.
The cause-and-effect diagram became one of his best-known contributions. Its simplicity made it suitable for collaborative problem solving while still encouraging rigorous causal thinking.
2.2 Quality Management Origins
The fishbone diagram emerged from a quality philosophy that emphasized prevention rather than inspection alone. Instead of merely detecting defective products at the end of production, organizations began examining the processes that created those defects.
This shift changed quality management fundamentally. Problems were treated as outcomes of systems, and systematic investigation became essential for eliminating recurrence.
2.3 Manufacturing Applications
Manufacturing provided an ideal environment for fishbone analysis because production problems typically involve multiple technical and operational variables. A recurring defect might originate from worn tooling, incorrect machine settings, material inconsistency, operator technique, environmental conditions, or measurement error.
By organizing these possibilities visually, manufacturing teams could conduct more disciplined investigations and avoid indiscriminate corrective actions.
2.4 Modern Business Use
Today, fishbone diagrams are used far beyond factory environments. Healthcare organizations apply them to patient safety events, service businesses analyze complaints and process delays, logistics teams investigate delivery failures, and project managers use them to study schedule deviations.
The underlying logic remains unchanged: define the effect, identify possible causal families, investigate contributing factors, and validate which causes genuinely influence the outcome.
3. Fishbone Diagram Structure
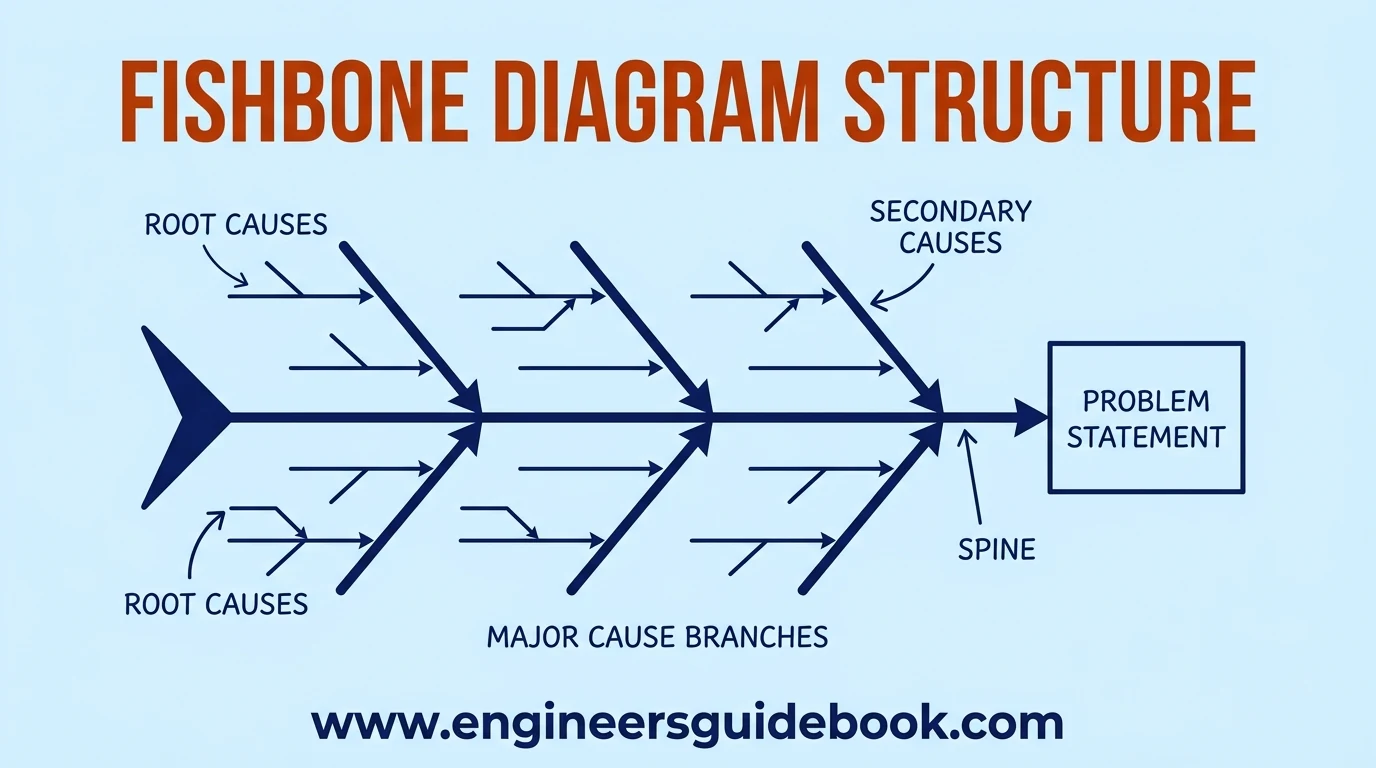
A fishbone diagram follows a straightforward architecture. Its value, however, depends on how precisely each component is developed. A poorly defined problem or excessively generic cause branch can weaken the entire analysis.
3.1 Problem Statement
The problem statement appears at the head of the fishbone and describes the effect being investigated. It should be specific, measurable, and narrow enough to support meaningful analysis.
“Machine problems” is too vague. “Packaging Line 2 experiences an average of 140 minutes of unplanned mechanical downtime per week” provides a much stronger analytical target.
3.2 Fishbone Spine
The main horizontal line represents the spine of the diagram. It connects the major cause branches to the problem statement.
Although the spine itself carries little analytical information, it creates a visual direction from possible causes toward the final effect. This makes the causal structure easy to interpret during workshops and investigations.
3.3 Major Cause Branches
Major branches represent broad families of potential causes. In manufacturing, these are often based on categories such as Man, Machine, Method, Material, Measurement, and Environment.
The categories act as prompts. Their purpose is not to force every problem into six rigid compartments, but to ensure that major causal domains are not overlooked.
3.4 Secondary Causes
Secondary causes extend from the major branches and describe more specific factors. For example, under Machine, possible causes might include bearing wear, lubrication failure, misalignment, inadequate cooling, sensor malfunction, or improper machine settings.
Additional subcauses can be added beneath these factors until the team reaches a useful level of specificity.
3.5 Root Causes
Root causes are the underlying factors that, when corrected or controlled, can prevent or significantly reduce recurrence. They are not automatically the deepest items written on the diagram.
A suspected root cause must be substantiated. Evidence may come from maintenance history, measurement data, experiments, inspections, trend analysis, process capability studies, or direct observation.
4. Fishbone Diagram Categories
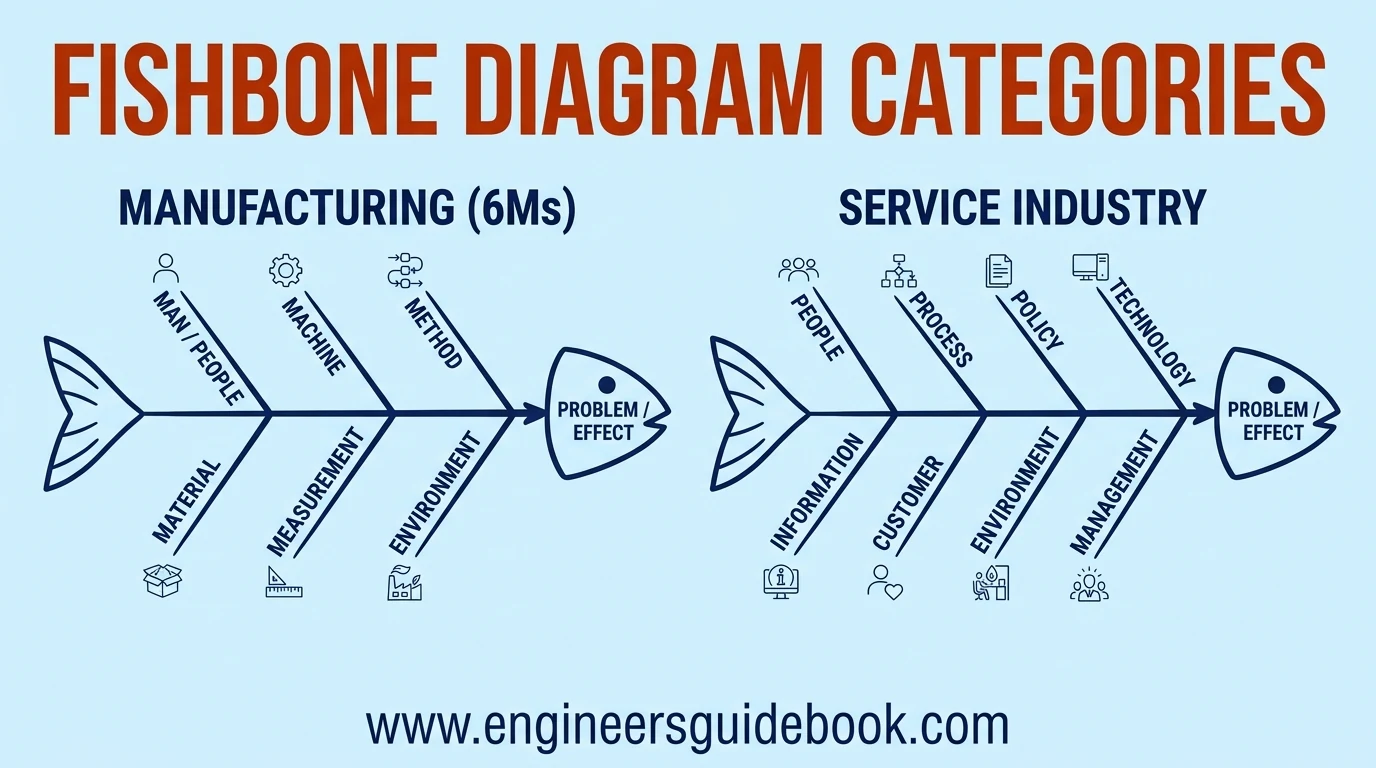
The conventional manufacturing fishbone frequently uses six major categories. These categories provide a comprehensive starting point, although organizations can modify them according to the nature of the process.
4.1 Man
The Man category covers human factors affecting the process. Examples include inadequate training, unclear responsibilities, fatigue, communication breakdowns, skill gaps, incorrect operating practices, or insufficient supervision.
Modern organizations may label this category People to use more inclusive terminology.
4.2 Machine
Machine includes equipment, tooling, instruments, utilities, hardware, and automation systems. Potential causes may involve wear, breakdowns, incorrect settings, inadequate maintenance, obsolete equipment, poor calibration, or equipment design limitations.
4.3 Method
Method concerns the procedures and operating practices used to perform work. Causes may include ineffective standard operating procedures, incorrect sequencing, excessive process variation, missing instructions, poor change-control practices, or inadequate preventive maintenance methods.
4.4 Material
Material includes raw materials, components, consumables, packaging materials, chemicals, and other process inputs. Variation in composition, dimensions, moisture, contamination, storage conditions, or supplier quality can significantly influence the final outcome.
4.5 Measurement
Measurement covers gauges, inspection systems, sensors, sampling methods, testing procedures, and data collection practices. An apparently unstable process may sometimes be caused by inaccurate or inconsistent measurement rather than the process itself.
4.6 Environment
Environment includes surrounding physical conditions such as temperature, humidity, vibration, dust, lighting, ventilation, noise, and workplace layout. External operating conditions may also be included when they influence process performance.
4.7 Service Industry Categories
Service organizations often customize fishbone categories to better represent their processes. Common alternatives include People, Process, Policy, Technology, Information, Customer, Environment, and Management.
The most effective categories are those that stimulate relevant investigation rather than merely conforming to a traditional template.
5. Fishbone Diagram Preparation
Effective fishbone analysis begins before the diagram is drawn. Good preparation ensures that brainstorming remains focused, evidence is available, and the right people contribute to the discussion.
5.1 Problem Selection
Choose a problem that is sufficiently important and clearly observable. Suitable topics include recurring equipment failure, process rejection, customer dissatisfaction, excessive energy consumption, missed production targets, or repeated safety deviations.
Avoid combining several unrelated problems into one diagram.
5.2 Team Formation
A multidisciplinary team usually produces stronger analysis. Include people who understand the process from different perspectives, such as operators, maintenance technicians, engineers, quality personnel, supervisors, planners, and process owners.
Diverse participation reduces tunnel vision and introduces practical knowledge that may not appear in formal procedures.
5.3 Data Collection
Gather relevant information before the session. Useful evidence may include downtime records, defect data, maintenance logs, inspection reports, process parameters, photographs, operator observations, alarm histories, and trend charts.
Data prevents the exercise from becoming a purely speculative brainstorming activity.
5.4 Scope Definition
Define clear boundaries for the investigation. Specify the equipment, product, process stage, time period, operating condition, or customer segment being analyzed.
A disciplined scope keeps the diagram manageable and prevents unrelated issues from diluting the investigation.
5.5 Brainstorming Preparation
Arrange the session so participants can contribute freely without prematurely rejecting ideas. At the early stage, the objective is to capture plausible causes.
Evaluation comes afterward. Separating idea generation from verification improves participation and helps uncover less obvious causal mechanisms.

6. How to Create a Fishbone Diagram
Creating an Ishikawa diagram involves a logical sequence from defining the problem to prioritizing corrective action. Each step should progressively transform broad possibilities into evidence-supported causes.
6.1 Define the Problem
Write a precise statement describing what is wrong, where it occurs, when it happens, and how significant it is. Quantification improves clarity whenever reliable data are available.
6.2 Draw the Main Spine
Draw a horizontal line pointing toward the problem statement. This becomes the visual backbone of the analysis and provides the foundation for major cause branches.
6.3 Select Cause Categories
Choose categories appropriate to the process. Manufacturing investigations commonly start with the six traditional categories, while administrative or service processes may require customized groupings.
6.4 Add Potential Causes
Brainstorm possible causes under each major category. Encourage participants to consider actual process conditions rather than generic textbook explanations.
Specific entries create a more useful diagram.
6.5 Expand Subcauses
For each important cause, ask what could create or influence it. Continue branching into secondary and tertiary causes where necessary.
Techniques such as the 5 Whys can be combined with fishbone analysis to explore deeper causal layers.
6.6 Validate the Causes
Review each significant cause against available evidence. Check records, inspect equipment, analyze trends, observe operations, conduct measurements, and perform controlled tests where appropriate.
Unsupported assumptions should remain hypotheses rather than accepted root causes.
6.7 Identify Root Causes
Determine which validated factors have a credible causal relationship with the problem. Strong root causes should explain why the problem occurs and provide a logical mechanism connecting the cause with the observed effect.
6.8 Prioritize Corrective Actions
Rank validated causes according to impact, recurrence risk, feasibility, cost, and urgency. Corrective actions should address causal mechanisms rather than merely suppress visible symptoms.
Follow-up monitoring is equally important because effectiveness must be demonstrated after implementation.

7. Fishbone Diagram Example
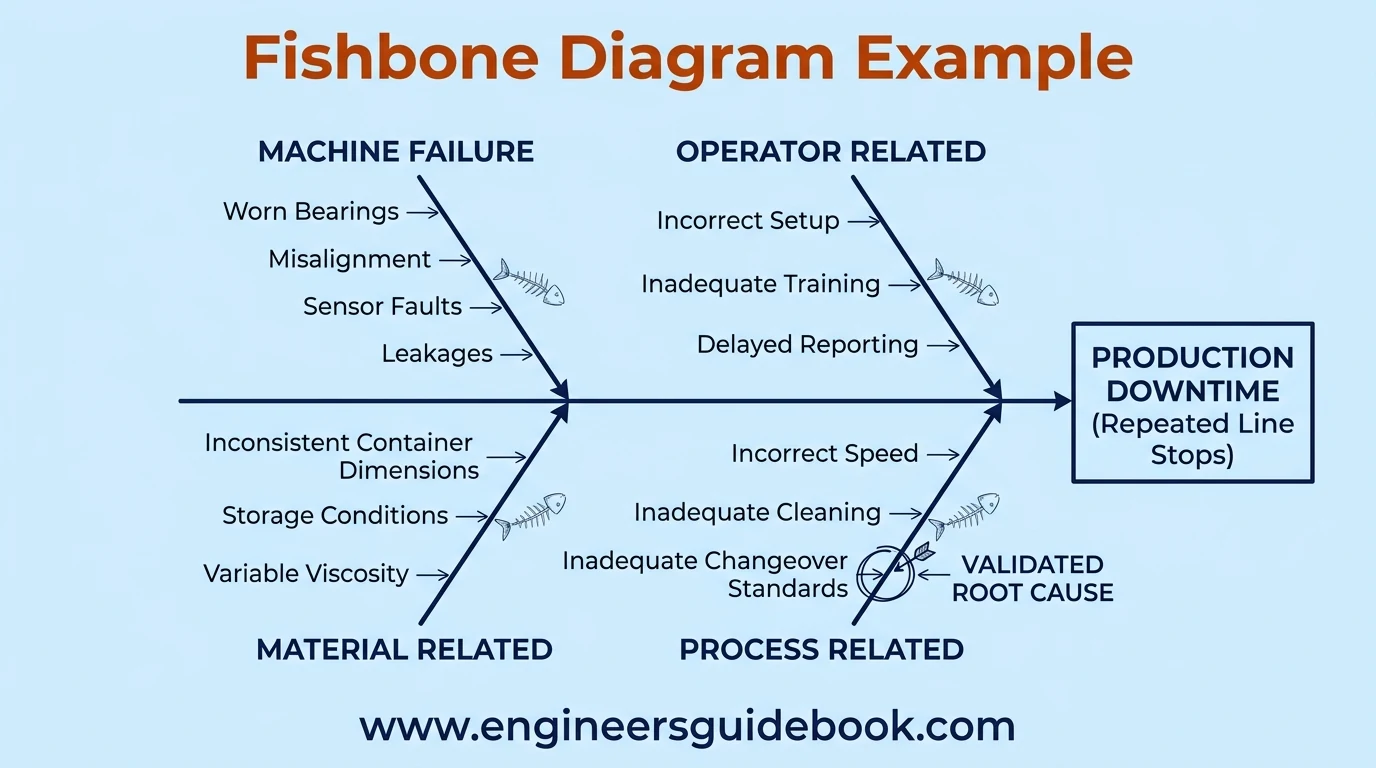
A production downtime example illustrates how fishbone analysis converts a broad operational issue into specific areas for investigation.
7.1 Production Downtime Example
Assume a filling line experiences repeated unplanned stops during production. The problem statement could specify excessive downtime caused by recurring line interruptions during normal operation.
The team then examines equipment, people, materials, methods, measurements, and environmental factors.
7.2 Machine Failure Causes
Machine-related possibilities might include worn bearings, conveyor misalignment, unstable sensors, pneumatic leakage, insufficient lubrication, motor overheating, damaged couplings, or recurring actuator faults.
Maintenance history can help determine which conditions coincide with downtime events.
7.3 Operator Related Causes
People-related causes may include incorrect setup, delayed abnormality reporting, inadequate troubleshooting knowledge, inconsistent changeover practices, or insufficient training on startup procedures.
These factors should be investigated objectively rather than used as a basis for assigning blame.
7.4 Material Related Causes
Material causes could include inconsistent container dimensions, damaged packaging components, variable product viscosity, contaminated raw material, or unsuitable storage conditions.
Supplier and inspection records may help confirm whether material variation correlates with machine stoppages.
7.5 Process Related Causes
Process causes might involve incorrect speed settings, inadequate cleaning procedures, poorly defined changeover standards, ineffective preventive maintenance intervals, or unstable operating parameters.
These systemic weaknesses often create repeated failures even when individual components are repaired.
7.6 Root Cause Selection
After completing the diagram, the team compares suspected causes with evidence. Suppose analysis shows that most stoppages occur after format changes and inspections reveal inconsistent guide-rail settings.
The team may identify an inadequate changeover standard as a validated root cause. A standardized setup procedure, defined dimensional settings, operator training, and post-changeover verification can then be implemented and monitored to confirm sustained improvement.
8. Fishbone Diagram Applications
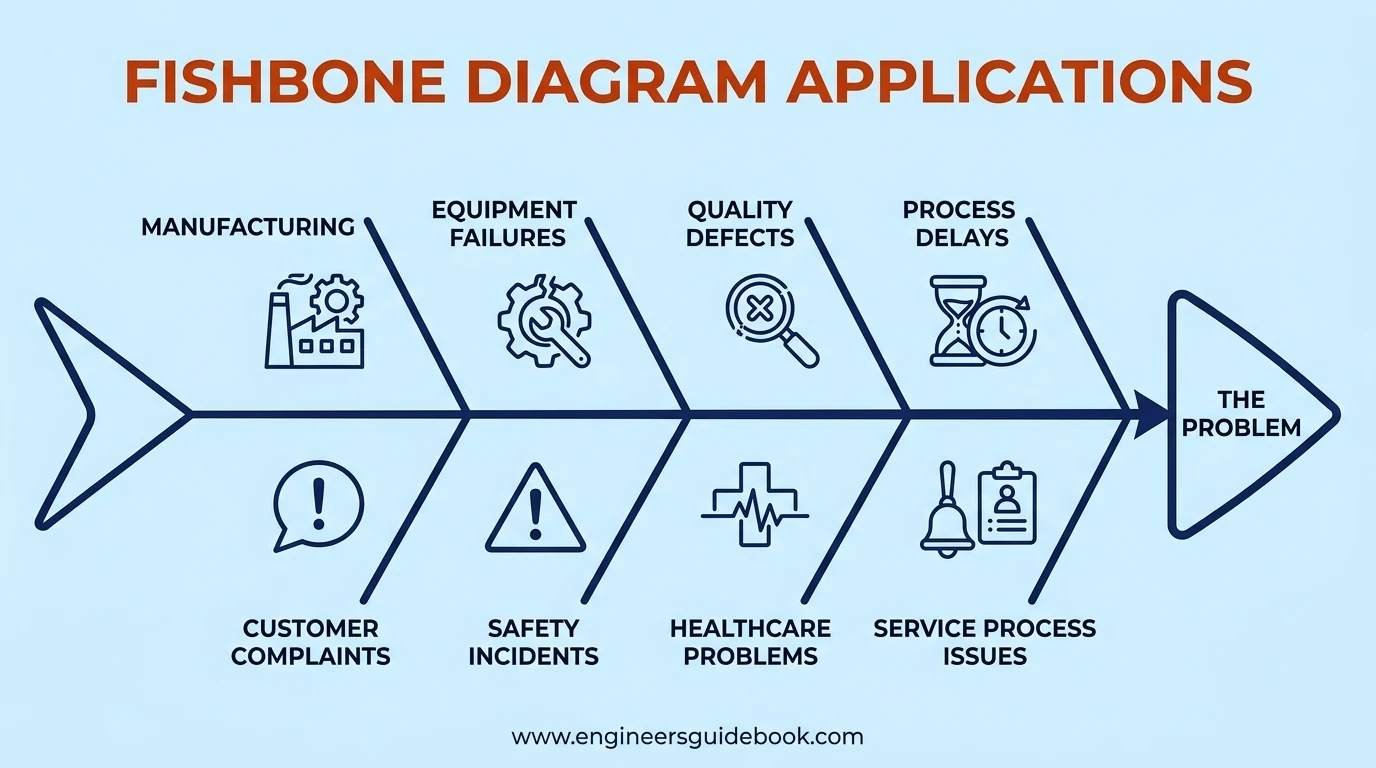
Fishbone diagrams are useful wherever a problem has multiple plausible causes and the investigation requires structured thinking. Although the method originated in quality management, its practical scope is much broader. It can support troubleshooting, operational improvement, safety analysis, healthcare investigations, service delivery, and customer experience management.
8.1 Manufacturing Problems
Manufacturing environments frequently use fishbone diagrams to investigate recurring operational problems. These may include low productivity, excessive scrap, equipment stoppages, poor yield, rework, unstable cycle times, or missed production targets.
The method helps teams examine the problem from several directions instead of focusing exclusively on machinery or operators. For example, low output may be linked to machine speed, raw material variation, staffing shortages, inadequate methods, measurement errors, or environmental constraints. The fishbone structure makes these relationships visible and easier to investigate.
8.2 Equipment Failures
Equipment failures often involve more than one technical cause. A pump bearing failure, for instance, may result from misalignment, lubrication deficiency, contamination, incorrect installation, vibration, excessive load, or inadequate preventive maintenance.
A fishbone diagram encourages maintenance teams to investigate the entire failure mechanism. This is particularly valuable for recurring breakdowns, where replacing the failed component alone may only restore operation temporarily without eliminating the underlying condition.
8.3 Quality Defects
Quality defects are another common application. Problems such as leakage, discoloration, dimensional variation, contamination, poor sealing, incorrect labeling, or surface defects can be analyzed using categories related to people, machine, method, material, measurement, and environment.
By mapping possible causes systematically, quality teams can separate actual process influences from conjecture. The diagram also helps identify which variables should be verified through inspection, sampling, testing, or process capability analysis.
8.4 Process Delays
Fishbone analysis can be applied to delays in production, procurement, logistics, maintenance, administration, and project execution. Possible causes may include approval bottlenecks, inadequate planning, unavailable resources, poor communication, excessive handoffs, software limitations, or unclear responsibilities.
The visual format is especially useful when delays emerge from several interconnected departments. It exposes systemic impediments rather than assigning responsibility to a single team.
8.5 Customer Complaints
Recurring customer complaints often indicate deeper process weaknesses. A fishbone diagram can organize possible causes related to product quality, order processing, communication, packaging, delivery, documentation, or after-sales support.
For example, repeated complaints about late deliveries may originate from inaccurate forecasting, warehouse congestion, transportation constraints, order-entry errors, or poor dispatch coordination. Identifying the causal chain enables more targeted corrective action.
8.6 Safety Incidents
Safety incidents rarely occur because of a single isolated mistake. A fishbone diagram can examine unsafe conditions, inadequate training, defective equipment, procedural weaknesses, supervision gaps, poor housekeeping, environmental hazards, and organizational factors.
However, safety investigations must go beyond superficial attribution. Labeling an incident as “operator error” is seldom sufficient. The analysis should examine why the error became possible and what controls failed to prevent escalation.
8.7 Healthcare Problems
Healthcare organizations use fishbone diagrams to analyze medication errors, patient falls, delayed treatment, documentation failures, infection risks, and communication breakdowns.
Potential causes may involve staffing, procedures, equipment, information systems, workload, environment, or handover practices. Because healthcare processes involve complex interactions, the fishbone format helps multidisciplinary teams investigate problems without reducing them to one individual action.
8.8 Service Process Issues
Service businesses can use fishbone analysis for long waiting times, billing errors, missed appointments, poor response times, customer dissatisfaction, or inconsistent service quality.
Categories can be adapted to People, Process, Policy, Technology, Information, Customer, and Environment. The framework should match the service process rather than forcing traditional manufacturing terminology onto an unsuitable context.
9. Fishbone Diagram Best Practices
A fishbone diagram is simple to draw, but its effectiveness depends heavily on how it is used. Good practice transforms the diagram from a brainstorming graphic into a disciplined root cause analysis instrument.
9.1 Specific Problem Statements
The problem statement should be precise and measurable. Statements such as “quality is poor” or “the machine keeps failing” are too broad to guide meaningful analysis.
A stronger statement defines what happened, where it occurred, when it occurs, and the magnitude of the problem. Specificity narrows the investigation and prevents unrelated causes from overwhelming the diagram.
9.2 Cross Functional Participation
Complex problems often cross departmental boundaries. Including representatives from production, maintenance, quality, engineering, supply chain, safety, or customer service can reveal causal factors that one function may overlook.
Cross-functional participation also improves acceptance of corrective actions because the analysis reflects multiple operational perspectives.
9.3 Evidence Based Causes
Brainstorming generates hypotheses, not conclusions. Every significant cause should eventually be compared with objective evidence.
Maintenance records, inspection findings, process data, photographs, alarms, customer records, laboratory results, and direct observations can help determine whether a proposed cause is credible. Evidence-based analysis prevents intuitive assumptions from becoming false root causes.
9.4 Deeper Cause Exploration
Teams should avoid stopping at the first plausible explanation. If “bearing failure” is listed, the investigation should continue by asking why the bearing failed.
Possible deeper causes could include contamination, inadequate lubrication, installation error, shaft misalignment, or excessive process load. Techniques such as the 5 Whys can be used within individual fishbone branches to deepen the investigation.
9.5 Cause Verification
Potential causes should be tested wherever practicable. Verification may involve measurement, controlled trials, inspections, comparison studies, or historical trend analysis.
A cause becomes much more persuasive when eliminating or controlling it produces a measurable change in the problem. Without verification, the fishbone remains a catalogue of possibilities.
9.6 Action Oriented Analysis
The purpose of root cause analysis is improvement, not documentation alone. Once verified causes are identified, corrective actions should specify ownership, completion dates, required resources, and effectiveness criteria.
Actions should address the causal mechanism directly. Temporary containment may be necessary, but long-term correction should reduce the probability of recurrence.

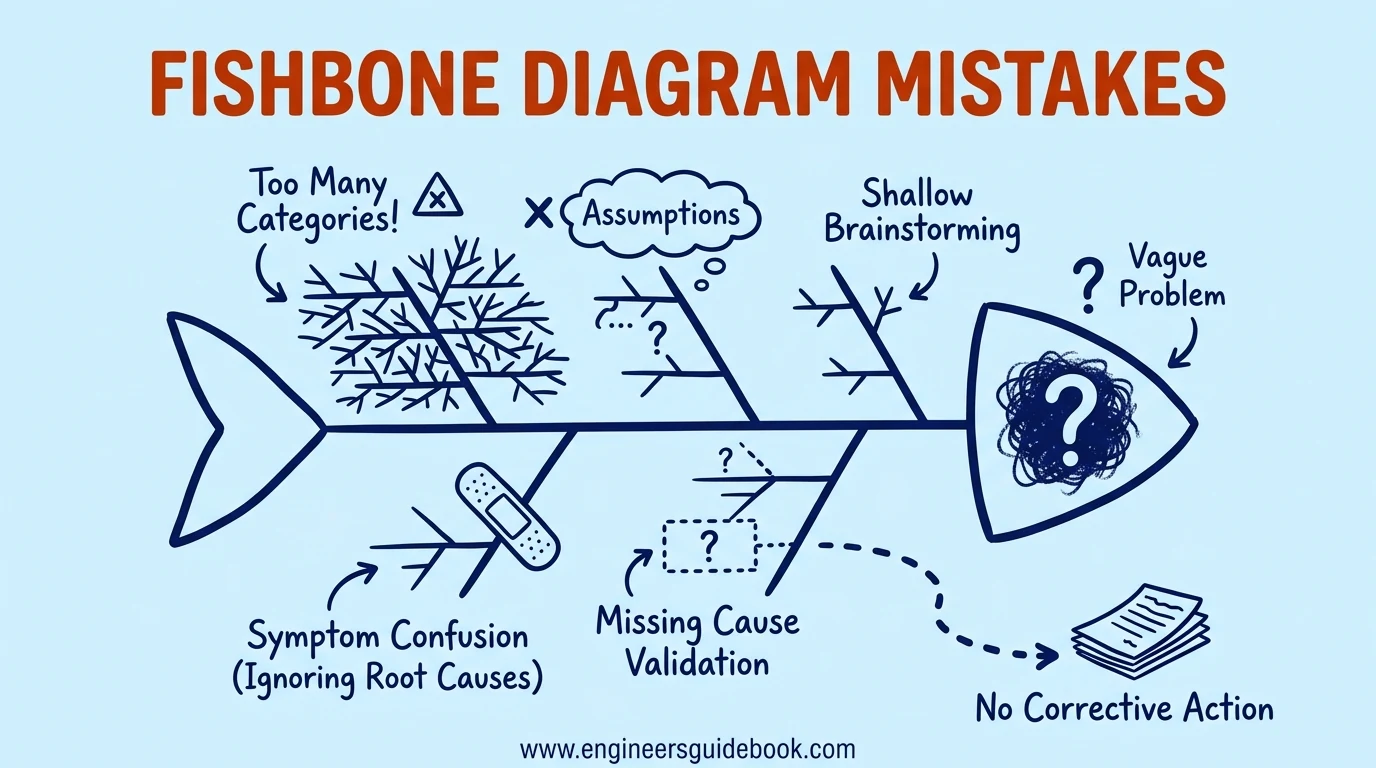
10. Fishbone Diagram Mistakes
Fishbone diagrams can become ineffective when teams use them mechanically or treat brainstorming as proof. Several common mistakes diminish analytical quality.
10.1 Vague Problem Statements
A vague problem statement produces vague causes. If the effect is poorly defined, participants may discuss several different problems simultaneously.
This creates a cluttered diagram with little diagnostic value. A narrow and quantifiable problem statement should therefore be established before cause generation begins.
10.2 Too Many Categories
Adding excessive categories can make the diagram cumbersome. Categories should help organize thinking, not create bureaucracy.
Six traditional branches are often sufficient, and fewer may be appropriate for some problems. Additional categories should only be introduced when they represent meaningful causal domains.
10.3 Assumption Based Causes
Teams sometimes promote familiar explanations without evidence. Statements such as “operator negligence,” “poor material,” or “machine problem” may reflect bias rather than fact.
Every assumption should be treated as a hypothesis until supporting evidence is obtained.
10.4 Shallow Brainstorming
A diagram that contains only obvious first-level causes offers limited value. Effective analysis explores causes beneath causes.
For example, “inadequate training” should lead to further questions. Was training unavailable, outdated, inconsistent, poorly assessed, or disconnected from actual job requirements? Depth creates actionable insight.
10.5 Symptom Confusion
Symptoms are often mistaken for root causes. Overheating, vibration, leakage, or rework may describe manifestations of a deeper problem.
Corrective action aimed only at symptoms can create temporary improvement while allowing recurrence. The analysis should trace these symptoms toward the mechanism that generated them.
10.6 Missing Cause Validation
A completed diagram does not prove causation. Failure to validate major causes is one of the most serious methodological errors.
Teams should use data, testing, inspection, or experimentation to determine which branches are genuinely associated with the effect.
10.7 No Corrective Action
Some organizations complete fishbone diagrams during meetings and then take no structured action. In that case, the exercise becomes administrative rather than preventive.
Verified root causes should lead directly to corrective actions, implementation ownership, and post-action effectiveness monitoring.
11. Fishbone Diagram Comparison
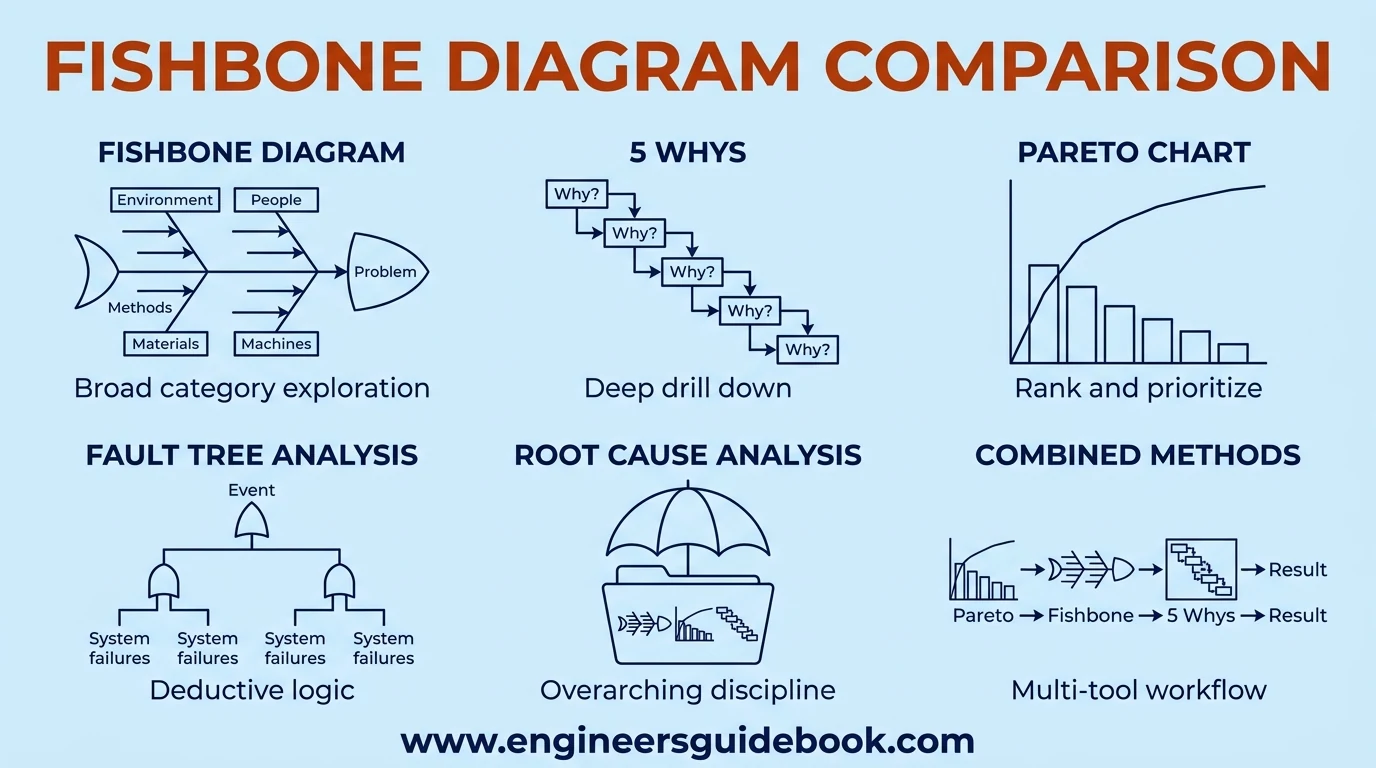
Fishbone analysis is one of several root cause tools. Understanding how it differs from related methods helps teams select the right technique for the problem.
11.1 Fishbone Diagram vs 5 Whys
A fishbone diagram explores multiple categories of possible causes simultaneously. The 5 Whys method follows one causal path by repeatedly asking why a condition exists.
Fishbone analysis is stronger for broad exploration, while 5 Whys is useful for drilling deeper into a specific branch. The two methods are often more effective when used together.
11.2 Fishbone Diagram vs Pareto Chart
A Pareto chart ranks problems or causes according to frequency, cost, impact, or another measurable criterion. It helps identify where attention should be concentrated.
A fishbone diagram, by contrast, explores why the selected problem may be occurring. Pareto analysis often identifies the priority problem first, after which fishbone analysis investigates its causes.
11.3 Fishbone Diagram vs Fault Tree Analysis
Fault Tree Analysis is a more formal deductive technique that begins with an undesirable top event and uses logical gates to model combinations of failures that could produce it.
Fishbone diagrams are generally simpler and more suitable for collaborative brainstorming. Fault trees provide greater logical rigor for complex engineering, reliability, and safety systems.
11.4 Fishbone Diagram vs Root Cause Analysis
Root cause analysis is a broader problem-solving discipline rather than a single tool. Fishbone diagrams are one method used within an RCA process.
A complete RCA may also include data analysis, 5 Whys, Pareto charts, fault trees, change analysis, barrier analysis, testing, and corrective action verification.
11.5 Combined Problem Solving Methods
Strong investigations often combine several tools. A Pareto chart can identify the most significant defect, a fishbone diagram can organize possible causes, and 5 Whys can investigate high-priority branches.
Data analysis can then validate the suspected causes. Combining methods reduces reliance on a single analytical perspective and strengthens the final conclusion.
12. Fishbone Diagram FAQs
12.1 What Is a Fishbone Diagram Used For
A fishbone diagram is used to identify, organize, and investigate possible causes of a defined problem. It is commonly applied to quality defects, equipment failures, process delays, safety incidents, customer complaints, and other recurring operational issues.
12.2 How Do You Create a Fishbone Diagram
Start by defining the problem, draw the main spine, add major cause categories, brainstorm possible causes, expand them into subcauses, and then validate the most credible causes using evidence. Verified causes should be translated into corrective actions.
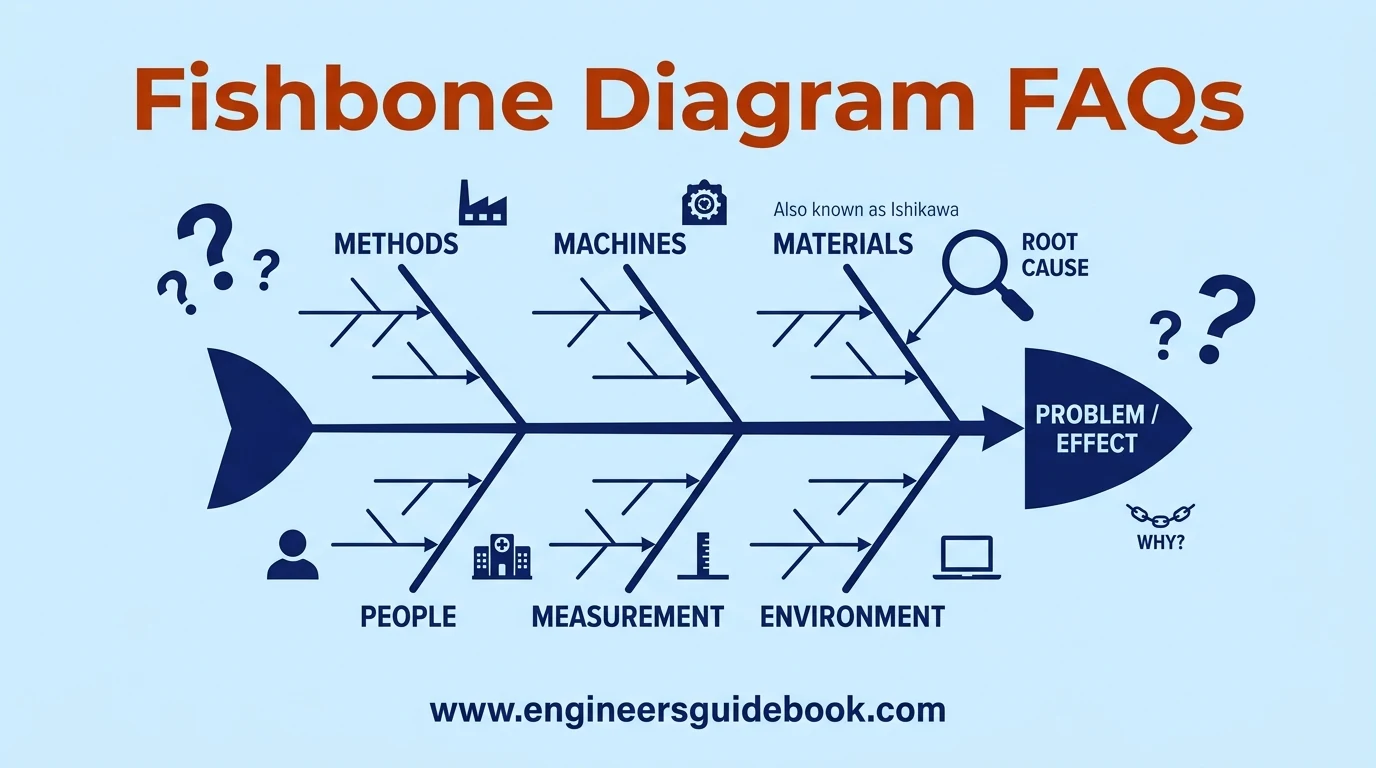
12.3 What Are the Six Categories of a Fishbone Diagram
The traditional six categories are Man, Machine, Method, Material, Measurement, and Environment. Many organizations replace Man with People and adapt the categories to suit their industry or process.
12.4 What Is Another Name for a Fishbone Diagram
A fishbone diagram is also called an Ishikawa diagram or cause-and-effect diagram. These terms describe the same basic root cause analysis technique.
12.5 What Is the Difference Between a Fishbone Diagram and 5 Whys
A fishbone diagram explores several possible causal categories at once, while 5 Whys investigates one causal chain in greater depth. They are complementary rather than competing methods.
12.6 How Do You Identify Root Causes Using a Fishbone Diagram
Root causes are identified by generating possible causes, exploring deeper subcauses, and validating the strongest candidates with data, inspection, testing, or observation. Causes should not be accepted solely because they appear plausible.
12.7 Can a Fishbone Diagram Be Used Outside Manufacturing
Yes. Fishbone diagrams are widely used in healthcare, logistics, administration, software, customer service, construction, education, and many other sectors where complex problems require structured causal analysis.
12.8 What Are the Limitations of a Fishbone Diagram
A fishbone diagram does not quantify causation, rank causes automatically, or prove that a suspected factor created the problem. Its quality depends on the team’s knowledge, available evidence, and willingness to verify assumptions.
13. Conclusion
A fishbone diagram provides a practical and adaptable framework for understanding why problems occur. Its greatest strength lies in its ability to convert scattered ideas into an organized causal structure that can be investigated systematically.
The method promotes structured brainstorming, cross-functional collaboration, deeper problem exploration, and better documentation. It also reduces premature conclusions by forcing teams to consider multiple causal domains.
Its visual simplicity makes it useful for both technical specialists and non-technical participants.