Fault Tree Analysis (FTA) is a systematic, top-down risk assessment technique used to identify the combinations of failures that can cause an undesirable event. It uses standardized event symbols, logical gates, and probability calculations to examine system reliability. Engineers apply FTA to investigate equipment failures, identify critical risks, and develop effective preventive measures.
1. Introduction to Fault Tree Analysis
1.1. What Is Fault Tree Analysis
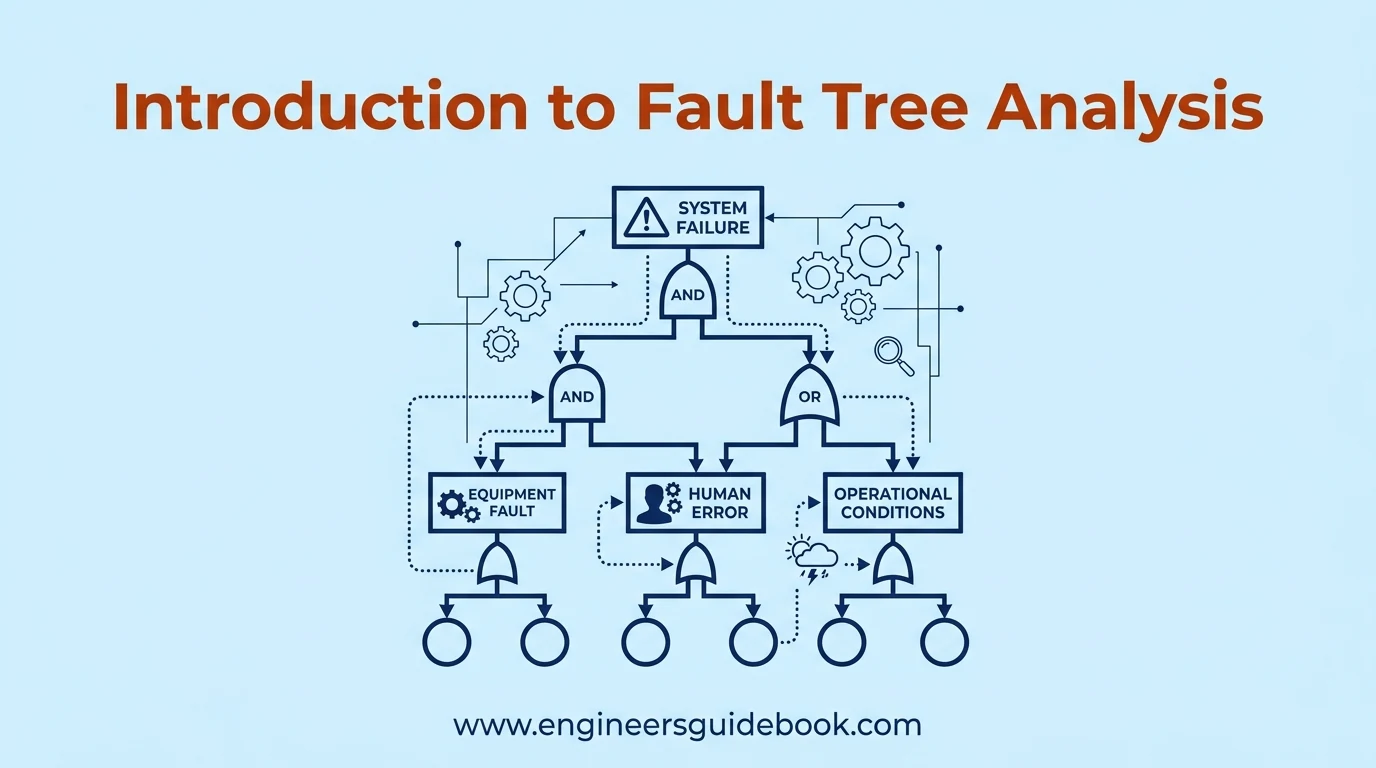
Fault Tree Analysis (FTA) is a deductive engineering technique that identifies potential causes of system failure. It represents relationships between equipment faults, human errors, and operational conditions through a graphical fault tree diagram.
1.2. Why Fault Tree Analysis Matters in Engineering
Modern industrial systems contain interconnected components where seemingly minor malfunctions can trigger significant operational disruptions.
FTA helps engineers identify vulnerabilities, understand failure dependencies, and prioritize reliability improvements before catastrophic events occur.
1.3. History and Development of Fault Tree Analysis
Fault Tree Analysis originated at Bell Laboratories in 1962 during the development of the Minuteman missile system.
Its applications subsequently expanded into aerospace, nuclear energy, chemical processing, manufacturing, and other safety-critical industries.
1.4. Main Objectives of Fault Tree Analysis
The primary objectives include identifying failure mechanisms, assessing system vulnerabilities, estimating failure probabilities, and determining effective preventive controls.
FTA also supports engineering decisions regarding equipment redundancy, maintenance priorities, and operational safeguards.
1.5. Importance of FTA in Risk Assessment and Reliability Engineering
FTA connects reliability engineering with systematic risk evaluation.
By examining combinations of component failures, engineers can identify single points of failure , common-cause vulnerabilities, and weaknesses in protective systems.
1.6. Common Industrial Applications of Fault Tree Analysis
Common applications include machinery breakdown investigations, electrical protection failures, pressure-system accidents, process safety assessments, and transportation safety studies.
It is particularly valuable when equipment failures can affect personnel safety, production continuity, or environmental protection.
2. Understanding the Fundamentals of Fault Tree Analysis
2.1. How Fault Tree Analysis Works
FTA begins with an undesirable event and progressively identifies the conditions capable of producing it.
Logical gates connect these conditions, creating a structured representation of potential failure pathways.
2.2. Understanding the Top-Down Deductive Approach
Unlike bottom-up analysis, deductive reasoning starts with a defined system failure and works backward toward contributing causes.
This approach keeps the investigation focused on a specific undesirable outcome.
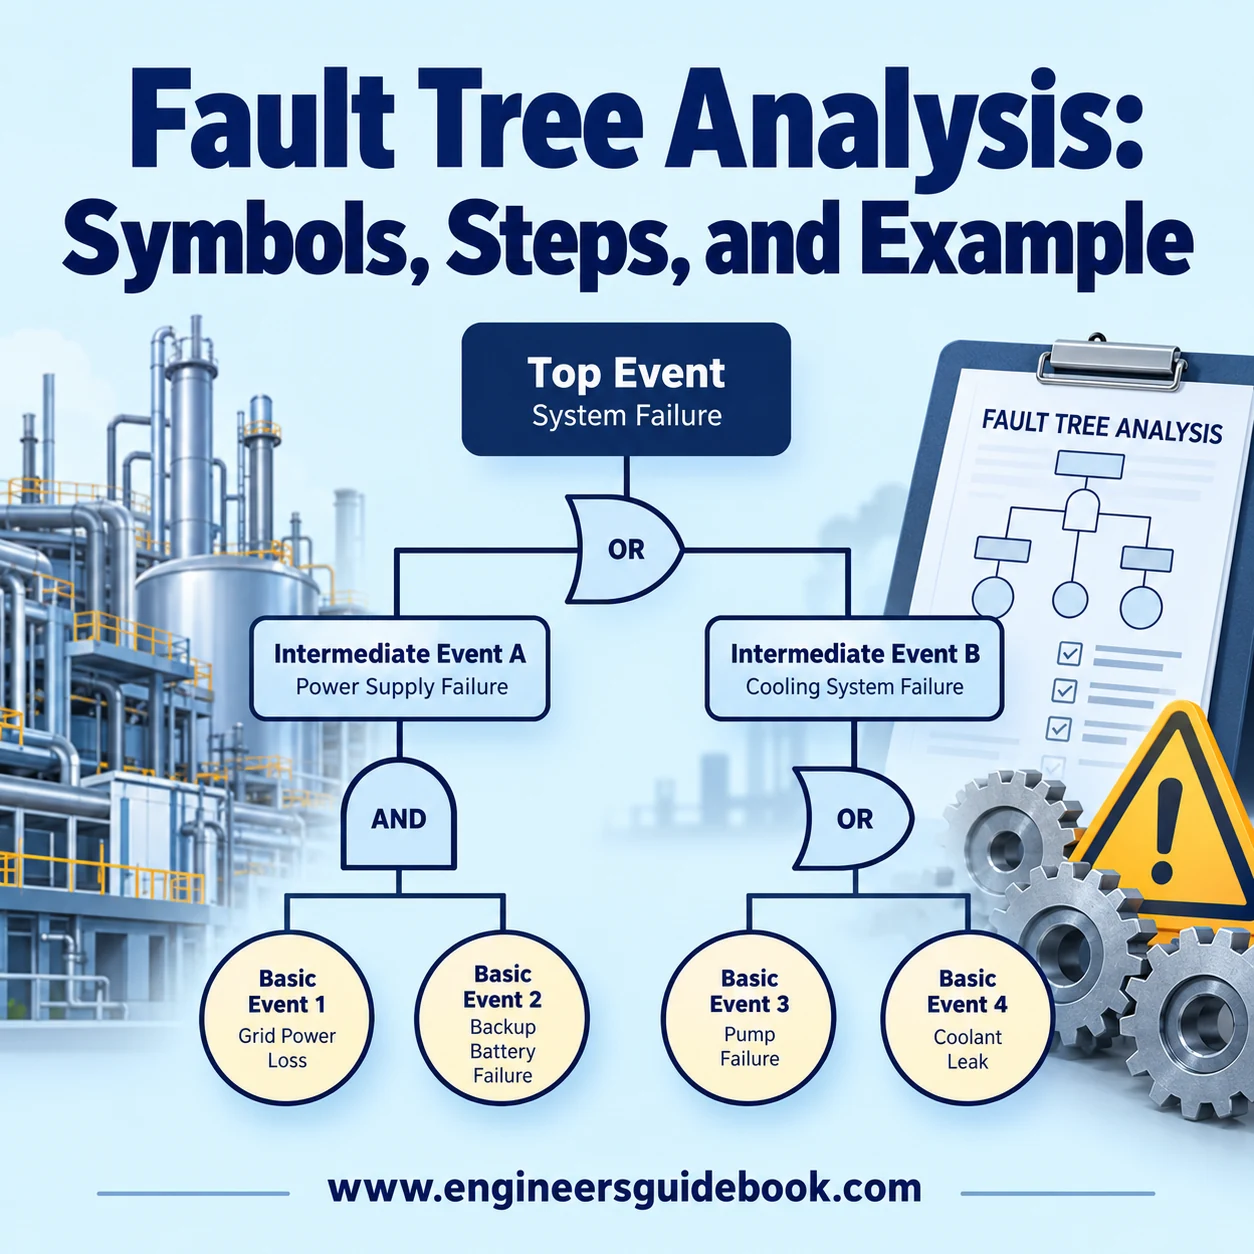
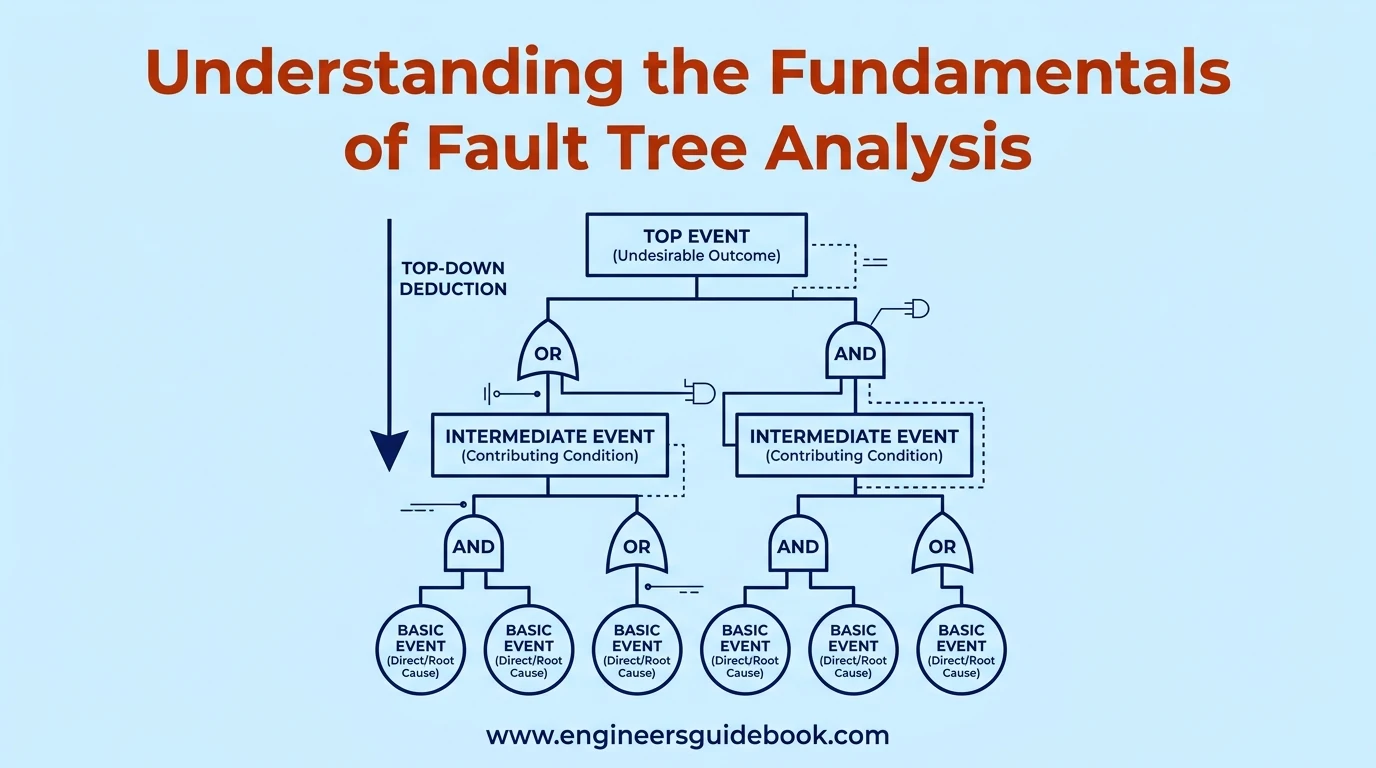
2.3. Top Events, Intermediate Events, and Basic Events
A top event represents the failure being investigated.
Intermediate events represent contributing failures requiring further decomposition, while basic events describe individual faults that are not developed further within the analysis.
2.4. Understanding Failure Causes and Logical Relationships
Failure causes may operate independently or require simultaneous occurrence.
For example, a pump may stop because its motor fails, whereas loss of a protected function may require both primary and standby equipment to become unavailable.
2.5. Boolean Logic in Fault Tree Analysis
Boolean algebra establishes logical relationships among failure events.
AND gates represent combined conditions, while OR gates represent alternative causes. These relationships form the mathematical foundation of fault tree calculations.
2.6. Qualitative and Quantitative Fault Tree Analysis
Qualitative FTA identifies possible failure combinations and critical pathways.
Quantitative FTA additionally uses failure probabilities or reliability data to estimate the likelihood of the top event.
2.7. System Boundaries, Assumptions, and Failure Criteria
Clear boundaries define which equipment, operating conditions, and external influences are included.
Assumptions concerning operating duration, component independence, and maintenance conditions must be documented to ensure defensible conclusions.
2.8. Understanding the Structure of a Fault Tree Diagram
A fault tree generally places the top event at the highest level.
Intermediate events and logic gates occupy successive branches, while basic events appear at the lowest developed level.
3. Fault Tree Analysis Symbols and Their Meanings
3.1. Overview of Standard FTA Symbols
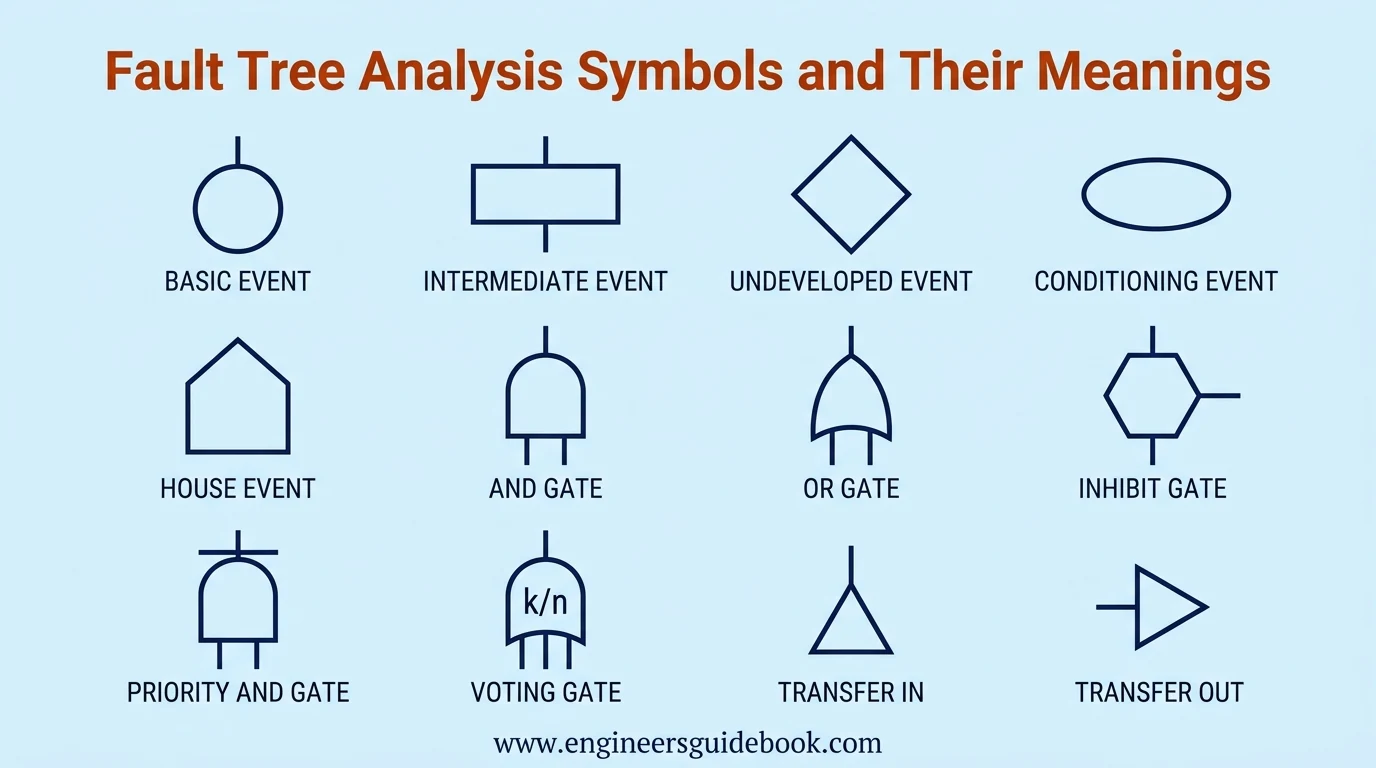
FTA uses standardized graphical conventions to distinguish failures, logical relationships, and transferred branches.
Consistent notation improves technical communication and reduces ambiguity during multidisciplinary risk assessments.
3.2. Event Symbols Used in Fault Tree Analysis
Event symbols identify the nature and developmental status of each condition represented within the diagram.
3.2.1. Basic Event Symbol
A circle represents a basic event, such as bearing seizure or an electrical component failure.
3.2.2. Intermediate Event Symbol
A rectangle represents an event developed further through lower-level failures and logical gates.
3.2.3. Undeveloped Event Symbol
A diamond identifies an event that is not analyzed further because of insufficient information or limited relevance.
3.2.4. Conditioning Event Symbol
An ellipse represents a condition governing the applicability of certain logical relationships, particularly inhibit gates.
3.2.5. House Event Symbol
A house-shaped symbol represents a condition deliberately treated as true or false within a particular analysis scenario.
3.3. Logic Gate Symbols in Fault Tree Analysis
Logic gates specify the combinations of input events necessary to produce an output event.
3.3.1. AND Gate Symbol
An AND gate produces its output only when every required input event occurs.
3.3.2. OR Gate Symbol
An OR gate produces its output when at least one connected input event occurs.
3.3.3. Exclusive OR Gate Symbol
An exclusive OR gate produces an output when exactly one of its input conditions is true.
3.3.4. Inhibit Gate Symbol
An inhibit gate produces an output when its input event occurs under a specified conditioning circumstance.
3.3.5. Priority AND Gate Symbol
A priority AND gate requires designated failures to occur in a particular sequence.
3.3.6. Voting Gate Symbol
A voting gate activates when a specified minimum number of input events occurs, commonly expressed as k-out-of-n.
3.4. Transfer Symbols in Fault Tree Diagrams
Transfer symbols connect separated sections of extensive fault trees without repeatedly drawing identical branches.
3.4.1. Transfer In Symbol
A transfer-in symbol identifies where an analysis continues from another diagram location.
3.4.2. Transfer Out Symbol
A transfer-out symbol directs readers toward the corresponding continuation of a fault tree branch.
3.5. Complete Fault Tree Analysis Symbols Chart
Symbol Typical Shape Function Basic event Circle Individual failure Intermediate event Rectangle Developed failure Undeveloped event Diamond Unexpanded event Conditioning event Ellipse Governing condition House event House Prescribed condition AND gate AND gate All inputs required OR gate OR gate Any input sufficient Inhibit gate Inhibit gate Conditional occurrence Transfer Triangle Branch continuation
3.6. How to Read and Interpret Fault Tree Symbols
Begin at the top event and trace each branch downward.
Examine the associated logic gates to determine whether failures occur independently, simultaneously, or under specified conditions.
3.7. Common Mistakes When Using FTA Symbols
Frequent errors include confusing AND and OR gates, overlooking repeated events, and incorrectly interpreting conditioning events.
These mistakes can significantly distort calculated system risk.
4. Types of Fault Tree Analysis
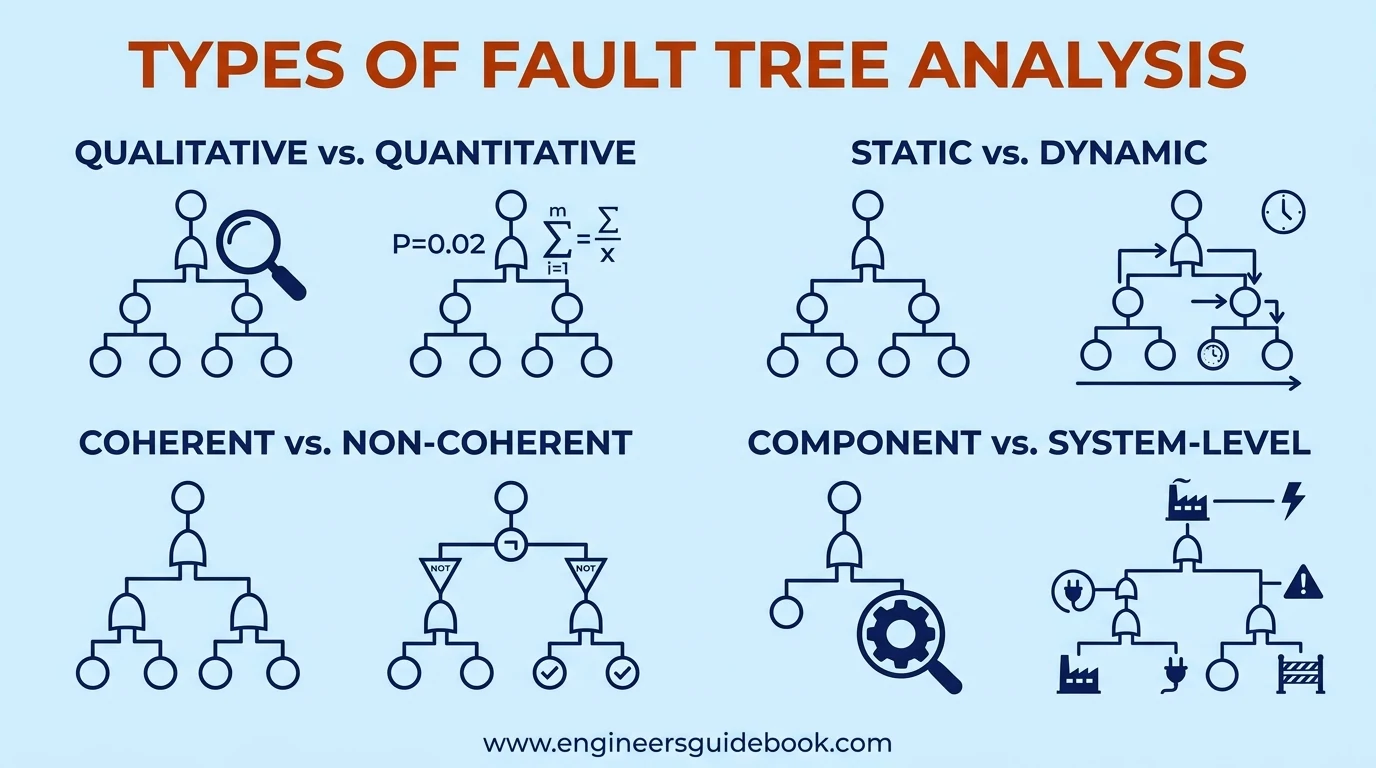
4.1. Qualitative Fault Tree Analysis
Qualitative FTA identifies failure combinations, minimal cut sets, and structural weaknesses without requiring numerical failure probabilities.
4.2. Quantitative Fault Tree Analysis
Quantitative FTA assigns probability values to events and calculates the likelihood of system failure under defined conditions.
4.3. Static Fault Tree Analysis
Static FTA evaluates failure relationships that do not explicitly depend on event sequence or dynamic system behavior.
4.4. Dynamic Fault Tree Analysis
Dynamic FTA incorporates sequencing, standby behavior, and functional dependencies that conventional static gates cannot adequately represent.
4.5. Coherent and Noncoherent Fault Trees
Coherent fault trees use monotonic failure logic, where additional component failures cannot prevent the top event.
Noncoherent trees may include NOT relationships or conditions involving successful component operation.
4.6. Component-Level and System-Level Fault Trees
Component-level analysis focuses on individual machinery or subsystems.
System-level analysis examines interactions among multiple components, supporting equipment, and protective functions.
4.7. Choosing the Right Type of Fault Tree Analysis
Selection depends on system complexity, available reliability data, failure dependencies, and the required analytical accuracy.
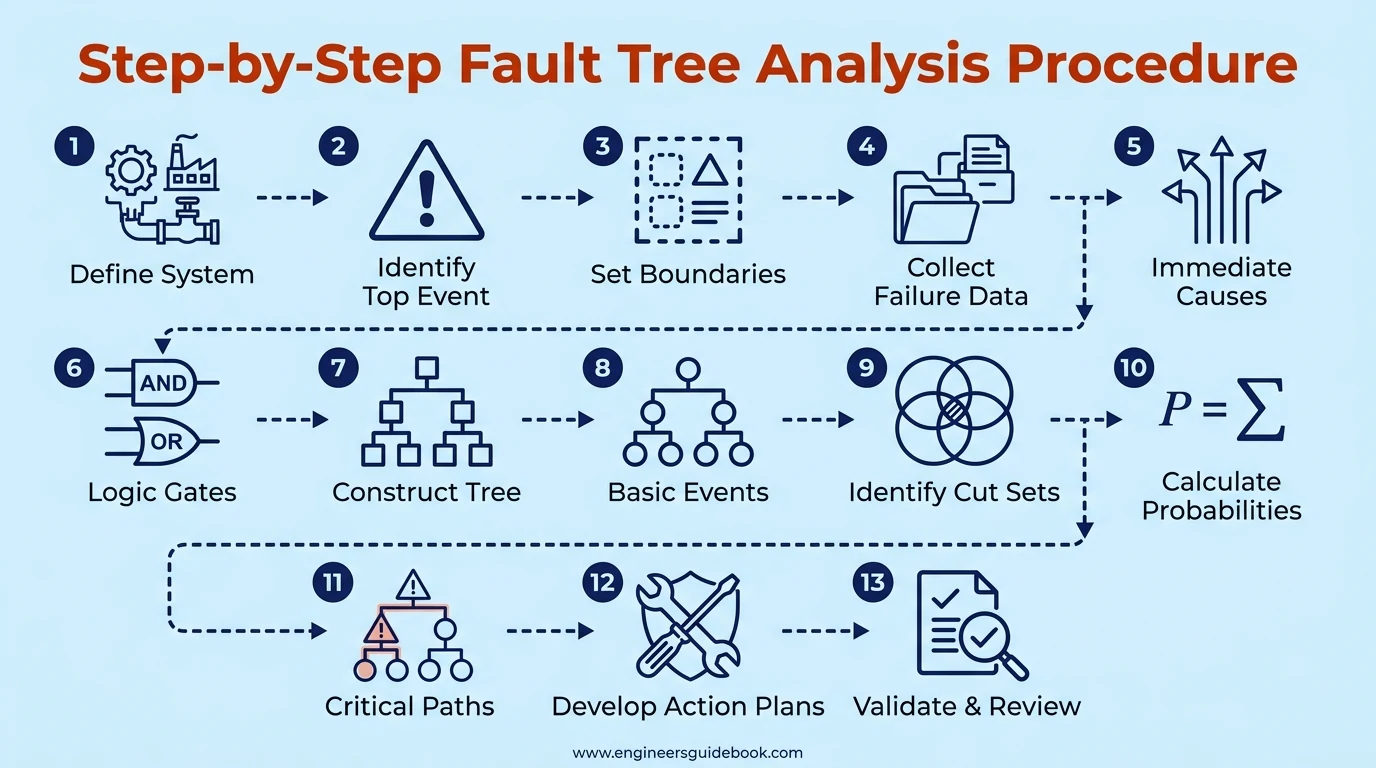
5. Step-by-Step Fault Tree Analysis Procedure
5.1. Step 1 – Define the System and Analysis Objectives
Identify the equipment, operating function, and specific reliability or safety concern.
5.2. Step 2 – Identify the Top Event
Describe the undesirable event precisely, including relevant operating conditions and failure thresholds.
5.3. Step 3 – Establish System Boundaries and Assumptions
Document included components, excluded influences, and conditions governing the investigation.
5.4. Step 4 – Collect Equipment and Historical Failure Data
Gather maintenance records, failure reports, operating histories, and available reliability statistics.
5.5. Step 5 – Identify Immediate Causes of the Top Event
Determine the direct failures or operational circumstances capable of producing the defined outcome.
5.6. Step 6 – Select the Appropriate Logic Gates
Connect events using gates that accurately represent their causal relationships.
5.7. Step 7 – Construct the Fault Tree Diagram
Arrange events hierarchically, beginning with the top event and proceeding toward contributing failures.
5.8. Step 8 – Break Down Intermediate Events into Basic Events
Continue decomposition until the analysis reaches an appropriate level of technical detail.
5.9. Step 9 – Identify Minimal Cut Sets
Determine the smallest combinations of basic events sufficient to produce the top event.
5.10. Step 10 – Calculate Failure Probabilities
Apply suitable probability models using validated failure data and dependence assumptions.
5.11. Step 11 – Identify Critical Failure Paths
Evaluate cut sets and importance measures to determine the most influential contributors.
5.12. Step 12 – Develop Corrective and Preventive Actions
Recommend engineering modifications, protective devices, inspections, and maintenance improvements.
5.13. Step 13 – Validate, Document, and Review the Analysis
Verify logic, assumptions, calculations, and recommended actions through appropriate technical review.
6. Fault Tree Analysis Example for Centrifugal Pump Failure
6.1. Overview of the Centrifugal Pump Failure Case Study
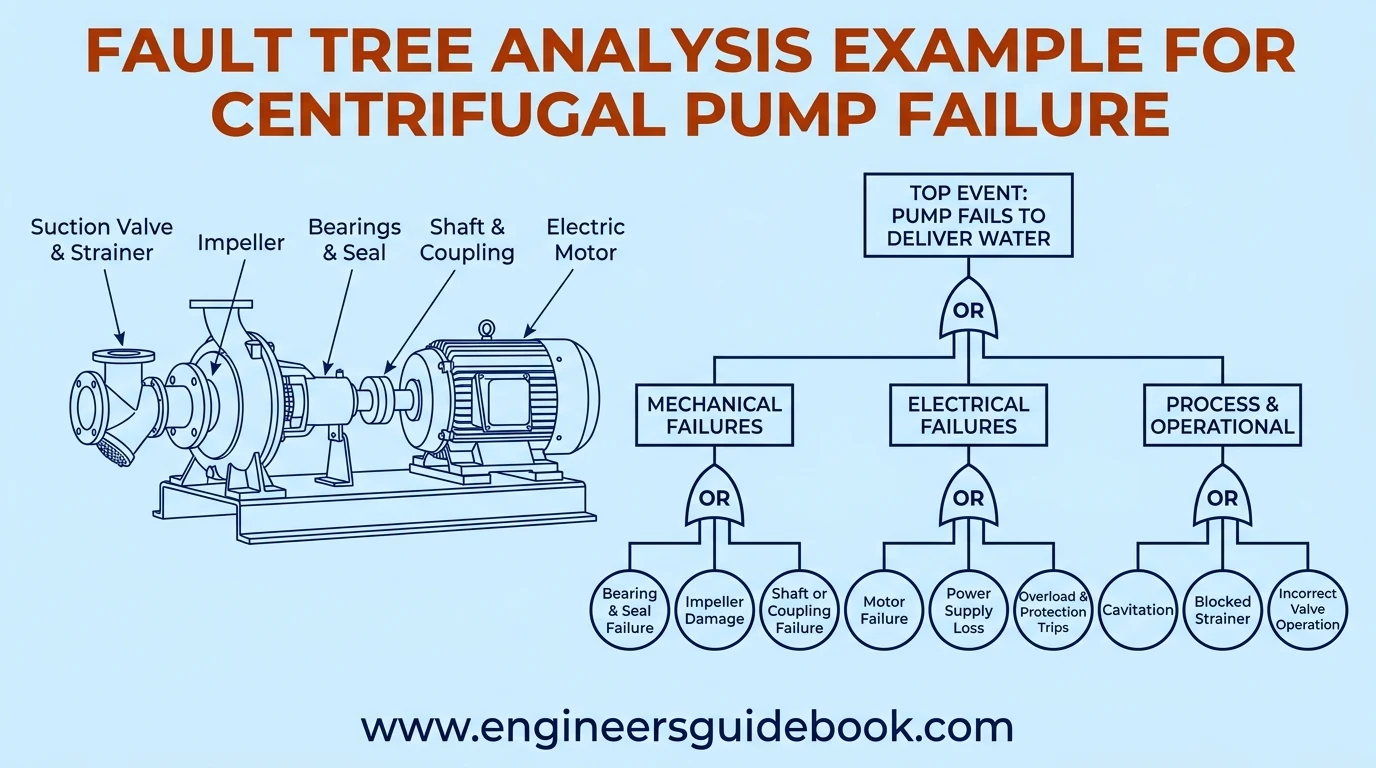
Consider an industrial centrifugal pump supplying cooling water to production equipment.
FTA examines mechanical, electrical, and process-related conditions that could interrupt water delivery.
6.2. Defining the Top Event and Failure Conditions
The top event is defined as the pump failing to deliver the required cooling-water flow during operation.
6.3. Identifying Mechanical Failure Causes
Mechanical failures can impair rotor movement, transmission efficiency, and hydraulic performance.
6.3.1. Bearing Failure
Lubrication starvation, contamination, or excessive loading can cause bearing deterioration and eventual seizure.
6.3.2. Mechanical Seal Failure
Seal damage can produce leakage and, under certain conditions, contribute to pump shutdown.
6.3.3. Impeller Damage
Erosion, corrosion, or fractured impeller components may reduce hydraulic performance.
6.3.4. Shaft Misalignment
Misalignment increases vibration, coupling stress, and bearing loads.
6.3.5. Coupling Failure
A damaged coupling can interrupt torque transmission between the motor and pump.
6.4. Identifying Electrical Failure Causes
Electrical malfunctions can stop the motor or prevent successful startup.
6.4.1. Electric Motor Failure
Winding damage, insulation degradation, or rotor defects may cause motor failure.
6.4.2. Power Supply Failure
Loss of electrical supply can prevent motor operation.
6.4.3. Motor Overload and Protection Trips
Excessive current or protective-system activation may interrupt operation.
6.5. Identifying Process and Operational Failure Causes
Process abnormalities can reduce flow even when mechanical components remain operational.
6.5.1. Cavitation
Insufficient available net positive suction head can produce vapor bubbles, vibration, and hydraulic deterioration.
6.5.2. Insufficient Suction Pressure
Low suction pressure can restrict flow and contribute to cavitation.
6.5.3. Blocked Suction Strainer
Accumulated debris increases suction resistance and reduces hydraulic performance.
6.5.4. Incorrect Valve Operation
Closed or improperly positioned valves can restrict the intended flow path.
6.6. Constructing the Centrifugal Pump Fault Tree Diagram
Group mechanical, electrical, and process failures into intermediate branches connected to the top event.
6.7. Applying AND and OR Gates to Pump Failure Events
Use OR gates for independently sufficient causes and AND gates where multiple conditions must coexist.
6.8. Identifying Minimal Cut Sets in the Pump Fault Tree
Identify individual failures or minimal combinations that independently cause insufficient cooling-water delivery.
6.9. Calculating the Probability of Pump Failure
Assign representative failure probabilities and evaluate the resulting logical expression.
6.10. Identifying the Most Critical Failure Contributors
Compare failure importance rather than assuming the most frequently observed component is necessarily the most critical.
6.11. Developing Preventive Maintenance and Reliability Improvements
Implement condition monitoring, lubrication control, alignment verification, and appropriate suction-system inspections.
6.12. Key Lessons from the Pump Failure Analysis
A well-defined fault tree reveals interacting vulnerabilities and supports targeted reliability improvements.
7. Fault Tree Analysis Calculations and Probability Formulas
7.1. Understanding Failure Probability and System Reliability
Failure probability expresses the likelihood of an event occurring within a specified mission or operating period.
Reliability represents the probability of successfully performing the required function.
7.2. Boolean Algebra and Fault Tree Logic
Boolean expressions convert the logical structure of fault trees into mathematical relationships suitable for probability evaluation.
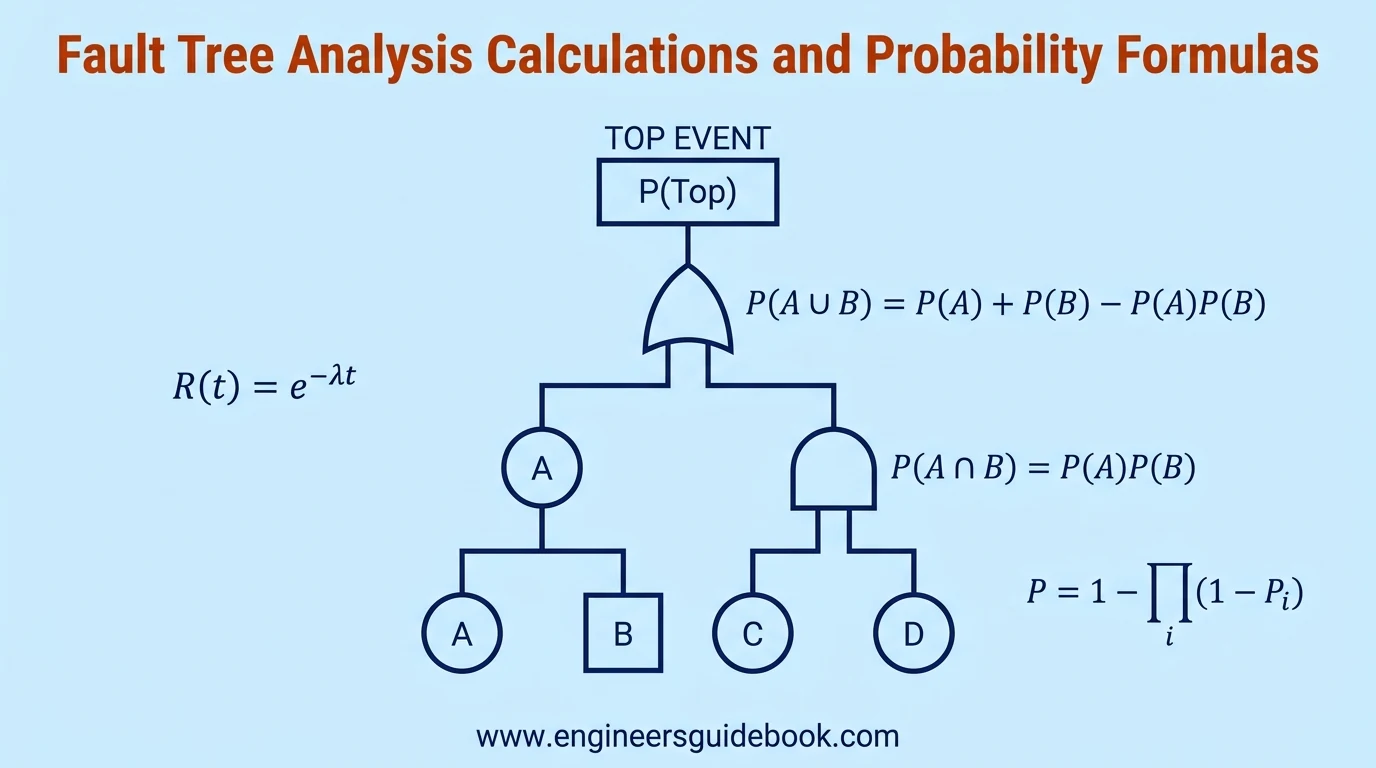
7.3. AND Gate Probability Formula
For two independent events A and B, the AND gate probability is:
P(A ∩ B) = P(A) × P(B)
This formula calculates the probability that both failure events occur.
7.4. OR Gate Probability Formula
For two independent events, the OR gate probability is:
P(A ∪ B) = P(A) + P(B) − P(A) × P(B)
This formula calculates the probability that at least one of the two failure events occurs.
7.5. Calculating Probabilities for Multiple Failure Events
For independent events, the probability of at least one failure is:
P = 1 − ∏(1 − Pᵢ), for i = 1 to n
Where:
- P = Probability of at least one failure
- Pᵢ = Probability of an individual failure event
- n = Total number of failure events
- ∏ = Product of all terms from i = 1 to n
7.6. Independent and Dependent Failure Events
Independent failures do not influence one another.
Dependent failures require conditional probability models or other appropriate dependency treatment.
7.7. Common Cause Failures and Their Impact
Common-cause failures arise when a shared influence simultaneously compromises multiple components, potentially defeating redundant protection.
7.8. Understanding Minimal Cut Sets
Minimal cut sets identify the smallest sufficient event combinations and help reveal critical system vulnerabilities.
7.9. Calculating Top Event Probability
The top event probability is obtained by evaluating the complete Boolean expression while accounting for repeated and dependent events.
7.10. Failure Rate, Reliability, and Unavailability
Under a constant failure-rate assumption, component reliability is:
R(t) = exp(−λ × t)
Where:
- R(t) = Reliability of the component at time t
- λ (lambda) = Constant failure rate
- t = Operating time
- exp = Exponential function, equivalent to raising Euler’s number (e) to the specified power
7.11. Component Importance Measures
Importance measures quantify how individual components contribute to overall system failure probability.
7.11.1. Birnbaum Importance Measure
Measures the sensitivity of top event probability to changes in an individual component’s failure probability.
7.11.2. Fussell-Vesely Importance Measure
Estimates the contribution associated with cut sets containing a particular basic event.
7.11.3. Risk Reduction Worth
Measures potential risk improvement when a selected component or event is made perfectly reliable.
7.12. Worked Numerical Example of FTA Calculations
Consider two independent failures with probabilities of 0.02 and 0.03.
For an OR gate:
P = 0.02 + 0.03 − (0.02 × 0.03)
P = 0.05 − 0.0006
P = 0.0494
The resulting event probability is 4.94%.
7.13. Common Probability Calculation Mistakes
Typical errors include assuming independence without justification, double-counting repeated events, mixing failure rates with probabilities, and neglecting common-cause dependencies.
8. Fault Tree Analysis Tools and Software
Fault Tree Analysis can be performed using simple diagrams or sophisticated reliability engineering platforms. The appropriate tool depends on system complexity, analytical requirements, and available engineering resources.
8.1. Creating Fault Tree Diagrams Manually
Manual fault trees use standardized symbols, connecting lines, and logical gates. Engineers begin with the top event and progressively develop contributing failure branches.
This approach works particularly well for preliminary hazard identification, training, and relatively uncomplicated equipment systems.
8.2. Fault Tree Analysis Using Microsoft Excel
Microsoft Excel provides a practical environment for documenting failure events, calculating probabilities, and organizing reliability data.
Engineers can use formulas, tables, and drawing shapes to develop elementary fault trees. However, complex Boolean calculations require careful validation.
8.3. Creating Fault Tree Diagrams in Microsoft Visio
Microsoft Visio supports professional fault tree diagrams through customizable shapes, connectors, and reusable templates.
Its diagramming capabilities simplify documentation and collaboration, although advanced probability calculations generally require additional analytical tools.
8.4. Specialized Fault Tree Analysis Software
Dedicated applications such as Isograph FaultTree+, ReliaSoft BlockSim, and CAFTA provide specialized reliability modeling capabilities.
Depending on the software, available functions may include minimal cut set generation, probability calculations, importance measures, and sensitivity analysis.
8.5. Open-Source Fault Tree Analysis Tools
Open-source options such as Open-PSA-related tools and SCRAM provide alternatives for reliability researchers and engineers.
These tools can support probabilistic safety assessment, although functionality, maintenance status, and technical documentation vary.
8.6. Essential Features of FTA Software
Effective software should provide logical gate libraries, probability calculations, minimal cut set identification, and clear reporting capabilities.
Advanced systems may additionally support common-cause failure modeling, uncertainty analysis, and integration with reliability databases.
8.7. Manual vs Software-Based Fault Tree Analysis
Manual methods offer transparency and flexibility for smaller investigations.
Software-based analysis improves consistency and computational efficiency when handling extensive fault trees, repeated events, and numerous failure combinations.
8.8. Selecting the Best FTA Software for Engineering Applications
Consider system complexity, required analytical precision, licensing costs, reporting requirements, and compatibility with existing maintenance systems.
For safety-critical applications, prioritize validated calculations, traceability, and documented modeling assumptions.

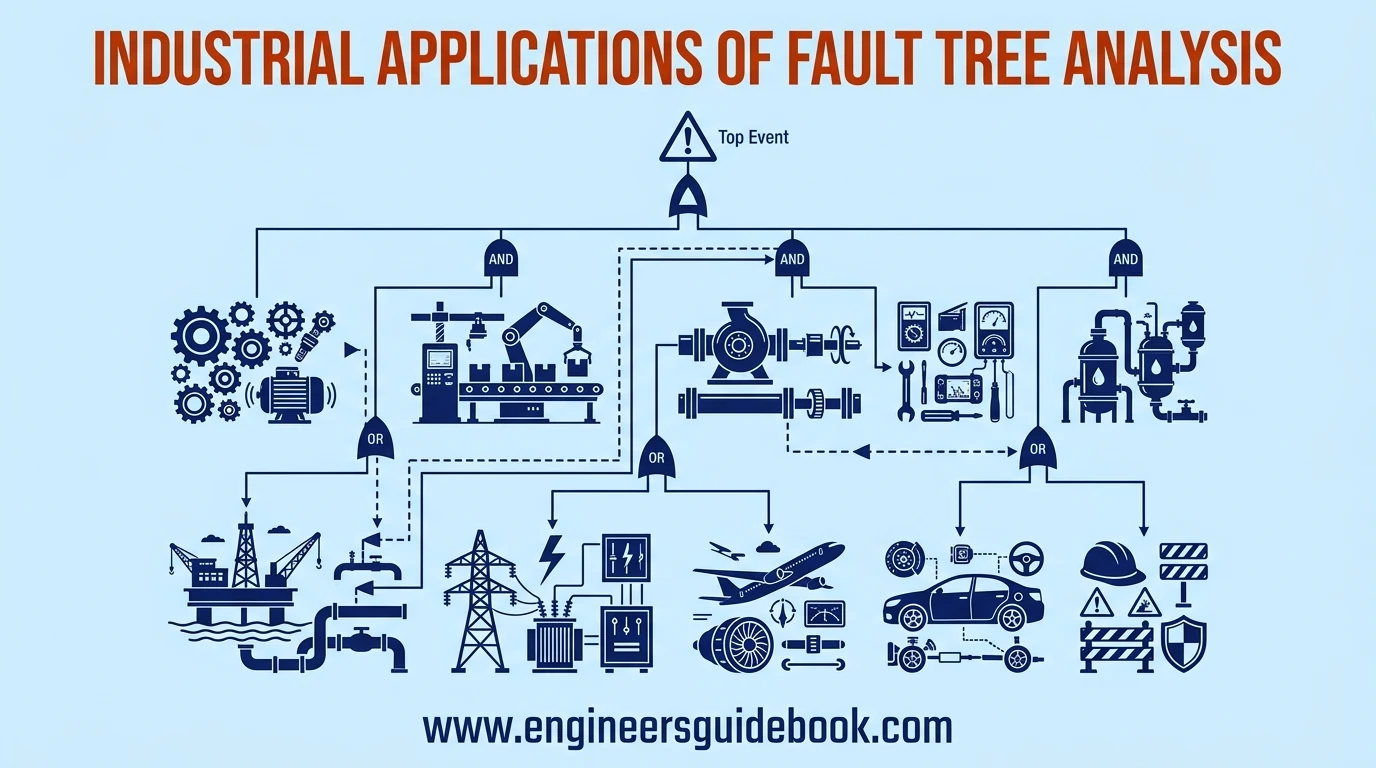
9. Industrial Applications of Fault Tree Analysis
9.1. Fault Tree Analysis in Mechanical Engineering
Mechanical engineers use FTA to investigate structural failures, component degradation, excessive vibration, and machinery breakdowns.
The technique clarifies how individual mechanical deficiencies contribute to larger system failures.
9.2. FTA in Manufacturing and Production Systems
Manufacturing facilities apply FTA to conveyor stoppages, packaging line failures, automation malfunctions, and unexpected production interruptions.
Identifying critical failure combinations helps improve operational continuity and equipment availability.
9.3. Fault Tree Analysis for Pumps and Rotating Equipment
FTA examines bearing failures, coupling damage, lubrication deficiencies, motor faults, and hydraulic abnormalities.
It is particularly useful for evaluating redundant pumping arrangements and identifying vulnerabilities affecting essential process services.
9.4. FTA in Preventive and Predictive Maintenance
Maintenance teams use fault trees to identify failure modes requiring inspections, condition monitoring, or scheduled interventions.
These insights support targeted vibration analysis, thermography, lubrication monitoring, and other predictive maintenance activities.
9.5. Fault Tree Analysis in Chemical and Process Industries
Chemical facilities investigate scenarios involving uncontrolled pressure, hazardous material releases, and protective-system failures.
FTA helps evaluate how equipment malfunctions and safeguards interact during hazardous operating conditions.
9.6. FTA in Oil and Gas Operations
Oil and gas facilities use FTA to assess pipeline failures, pressure containment losses, compressor breakdowns, and emergency shutdown system vulnerabilities.
Such analyses contribute to process safety management and major accident prevention.
9.7. Fault Tree Analysis in Electrical Power Systems
Electrical engineers examine transformer failures, protection relay malfunctions, circuit breaker failures, and power distribution interruptions.
FTA identifies combinations capable of defeating electrical redundancy or protective arrangements.
9.8. FTA in Aerospace and Aviation Safety
Aerospace applications include flight control systems, propulsion equipment, avionics, and critical electrical functions.
Fault trees support systematic evaluation of hazardous failure combinations within highly integrated systems.
9.9. Fault Tree Analysis in Automotive Engineering
Automotive engineers apply FTA to braking systems, steering controls, electronic safety systems, and propulsion equipment.
The methodology supports functional safety assessments and systematic identification of hazardous conditions.
9.10. FTA in Occupational Health and Safety
FTA helps investigate machinery-related accidents, uncontrolled energy releases, and failures of protective barriers.
It reveals how technical deficiencies and procedural weaknesses may combine to create dangerous circumstances.
9.11. Integrating FTA with Reliability-Centered Maintenance
Reliability-Centered Maintenance (RCM) determines appropriate maintenance strategies based on equipment functions and failure consequences.
FTA complements RCM by identifying critical combinations of failures and highlighting opportunities for risk reduction.
10. Advantages, Limitations, and Best Practices of Fault Tree Analysis
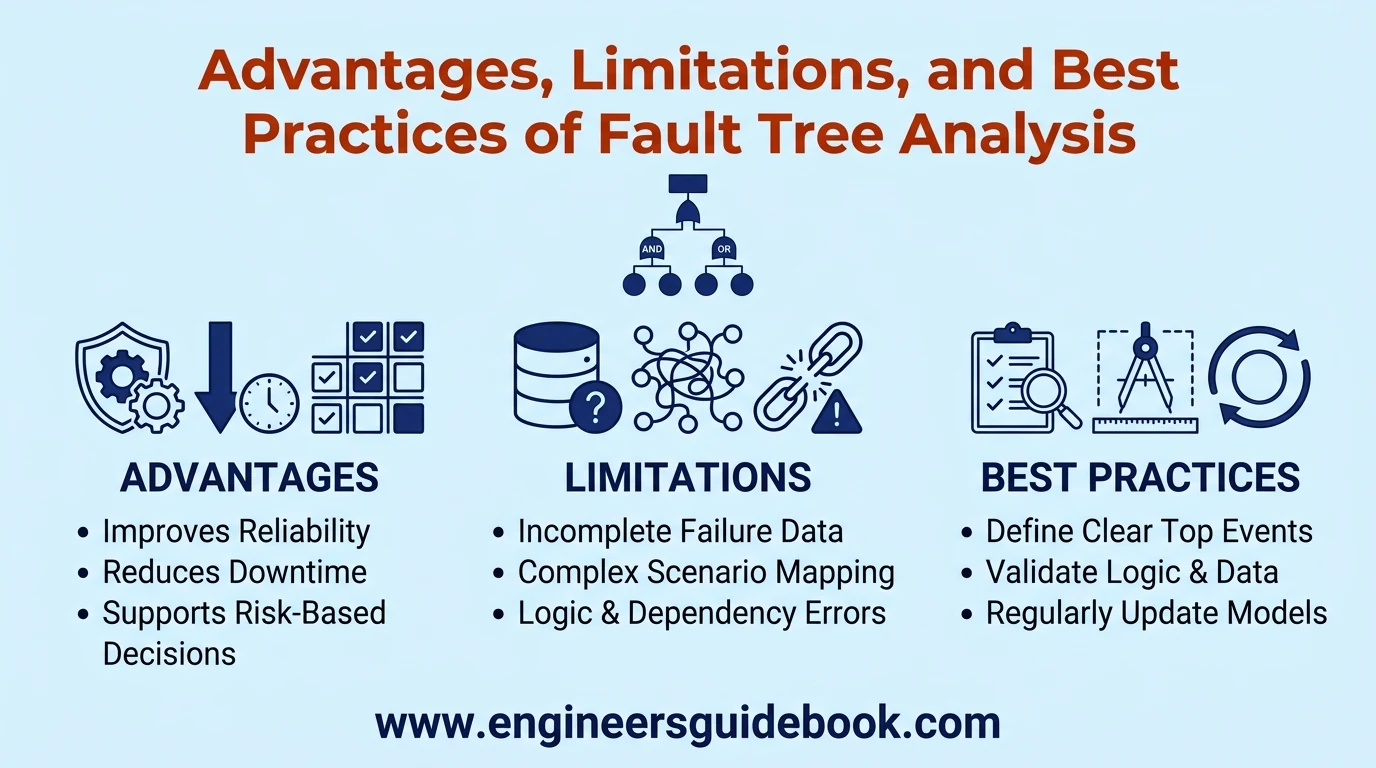
10.1. Major Advantages of Fault Tree Analysis
FTA provides a systematic, visually accessible method for identifying failure combinations.
It supports qualitative investigations and quantitative assessments while improving communication among engineering disciplines.
10.2. Improving Equipment Reliability and Availability
By identifying vulnerable components and ineffective redundancy, FTA supports modifications that improve operational reliability.
These improvements may include protective instrumentation, component redesign, or enhanced maintenance practices.
10.3. Reducing Unplanned Downtime and Maintenance Costs
Fault trees help maintenance departments prioritize failure mechanisms with significant operational consequences.
Targeted interventions can reduce recurring breakdowns, unnecessary inspections, and avoidable production interruptions.
10.4. Supporting Risk-Based Maintenance Decisions
FTA helps compare failure likelihoods and potential consequences when selecting maintenance priorities.
Its results support rational resource allocation rather than relying exclusively on fixed inspection intervals.
10.5. Limitations of Fault Tree Analysis
FTA depends on the completeness of identified failure scenarios and the validity of modeling assumptions.
Complex systems can produce extensive fault trees requiring substantial analytical effort.
10.6. Challenges in Collecting Reliable Failure Data
Incomplete maintenance histories, inconsistent failure classifications, and uncertain operating conditions undermine probability estimates.
Engineers should distinguish verified operational evidence from assumptions or generic reliability information.
10.7. Common Mistakes When Constructing Fault Trees
Typical mistakes include vague top events, missing failure causes, inappropriate gates, and duplicated event probabilities.
Poorly defined system boundaries can also produce misleading conclusions.
10.8. Avoiding Incorrect AND and OR Gate Selection
AND gates require all specified conditions, whereas OR gates require at least one.
The selected gate must reflect actual system behavior rather than a convenient diagramming arrangement.
10.9. Managing Common Cause and Dependent Failures
Shared power supplies, environmental conditions, and maintenance errors may simultaneously compromise multiple components.
Ignoring these dependencies can substantially underestimate system failure probability.
10.10. Validating Fault Tree Assumptions and Results
Validation should include engineering reviews, verification of logical relationships, examination of input data, and sensitivity testing.
Safety-critical calculations may require independent technical verification.
10.11. Best Practices for Accurate and Effective FTA
Define measurable top events, maintain consistent symbols, document assumptions, and use credible reliability data.
Regularly update fault trees when equipment configurations, operating conditions, or maintenance strategies change.
11. Fault Tree Analysis vs Other Failure Analysis Methods
11.1. Fault Tree Analysis vs Root Cause Analysis
FTA evaluates combinations capable of producing a defined undesirable event.
Root Cause Analysis generally investigates why an actual failure occurred and identifies underlying corrective actions.
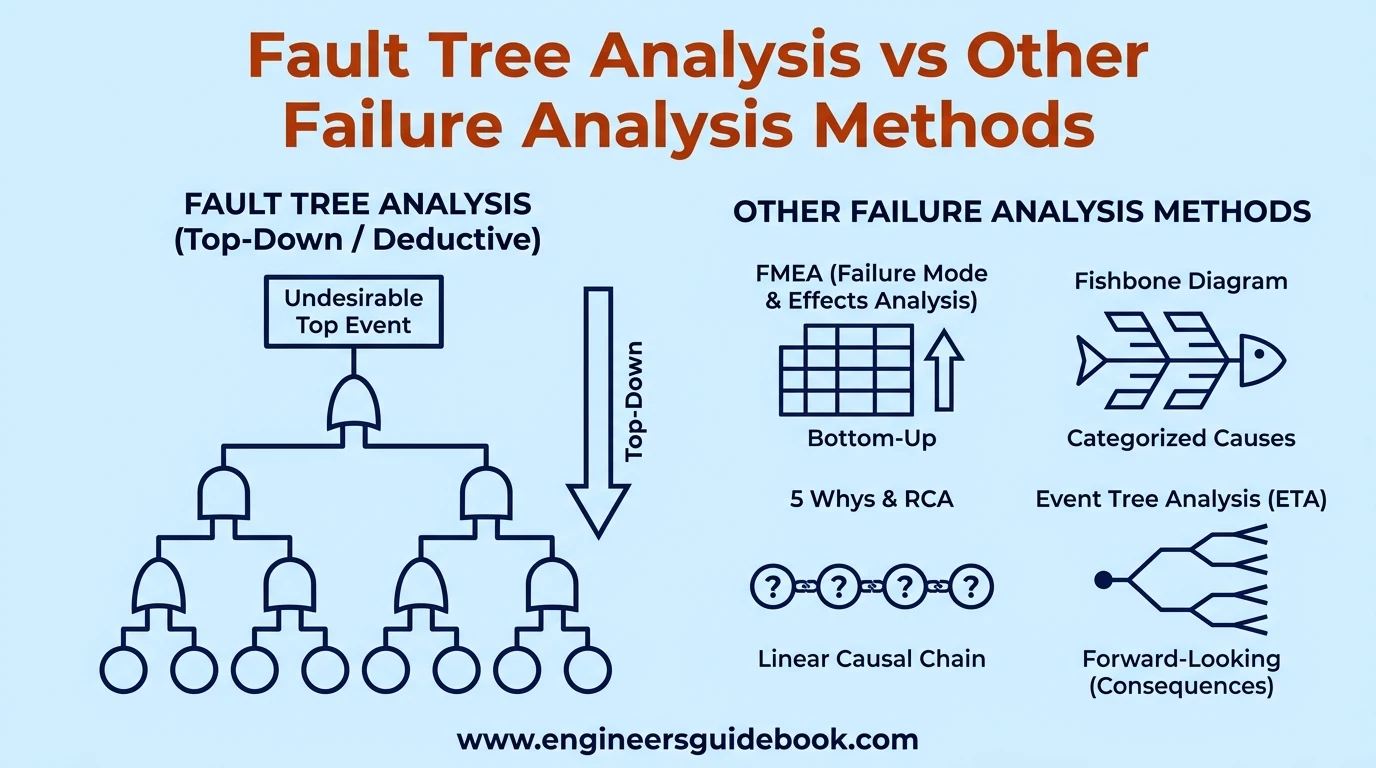
11.2. Fault Tree Analysis vs Failure Mode and Effects Analysis
FTA follows a top-down approach, beginning with a system failure.
Failure Mode and Effects Analysis (FMEA) works bottom-up, examining individual failure modes and their consequences.
11.3. Fault Tree Analysis vs Fishbone Diagram
Fishbone diagrams organize potential causes into categories.
FTA extends causal investigation by representing logical dependencies and enabling quantitative probability calculations.
11.4. Fault Tree Analysis vs 5 Whys Analysis
The 5 Whys technique investigates causal chains through repeated questioning.
FTA examines multiple interacting pathways, making it useful when failures involve complex combinations.
11.5. Fault Tree Analysis vs Event Tree Analysis
FTA works backward from an undesirable event toward its causes.
Event Tree Analysis works forward from an initiating event to evaluate possible consequences and protective responses.
11.6. Fault Tree Analysis vs Bow-Tie Analysis
Bow-Tie Analysis connects potential causes, preventive barriers, consequences, and mitigating safeguards.
FTA provides a more detailed logical examination of failure causation.
11.7. Fault Tree Analysis vs HAZOP
Hazard and Operability Study (HAZOP) systematically examines process deviations using guidewords.
FTA investigates the combinations of failures capable of producing selected hazardous events.
11.8. Fault Tree Analysis vs Reliability Block Diagrams
Reliability Block Diagrams represent functional success relationships between system components.
FTA models combinations of failures leading to an unwanted outcome.
11.9. Key Differences Between FTA and Other Reliability Tools
The primary distinction lies in analytical direction, treatment of logical dependencies, and intended application.
No single technique addresses every aspect of reliability and risk.
11.10. When to Use Fault Tree Analysis
Use FTA when a clearly defined undesirable event requires systematic causal examination.
It is particularly valuable for complex protective systems, redundant equipment, and safety-critical operations.
11.11. Combining FTA with Other Root Cause Analysis Techniques
Combining FTA with FMEA, HAZOP, and RCA provides a more comprehensive understanding of system vulnerabilities.
Each method contributes complementary perspectives on failures and preventive controls.
12. Frequently Asked Questions About Fault Tree Analysis
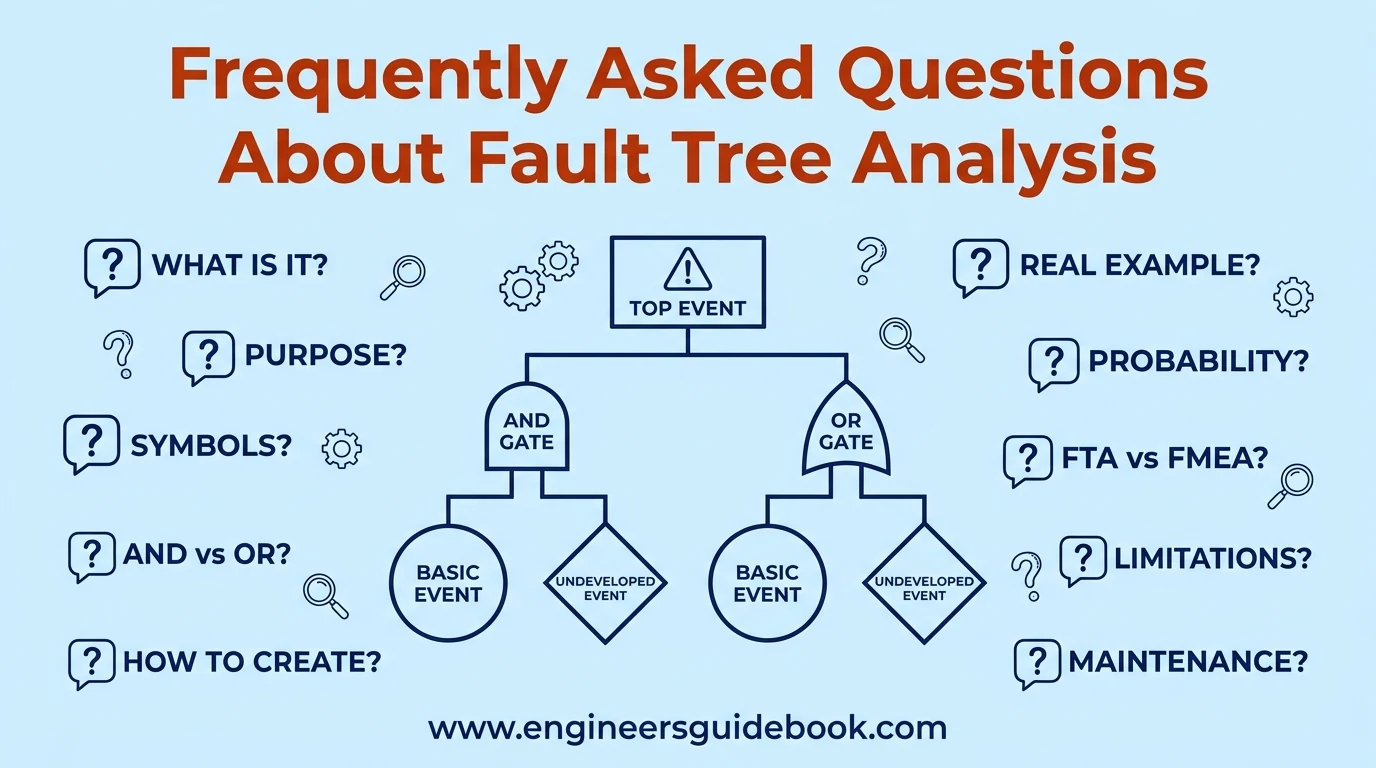
12.1. What Is Fault Tree Analysis in Simple Terms?
Fault Tree Analysis is a graphical method for identifying different failures and combinations of conditions that can cause a particular system problem.
12.2. What Is the Main Purpose of Fault Tree Analysis?
Its main purpose is to identify potential failure causes, evaluate their logical relationships, and support improvements in system reliability and safety.
12.3. What Are the Basic Symbols Used in Fault Tree Analysis?
Common symbols include circles for basic events, rectangles for intermediate events, diamonds for undeveloped events, and logical gate symbols.
12.4. What Is the Difference Between AND and OR Gates in FTA?
An AND gate requires every specified input condition to occur. An OR gate requires at least one input condition.
12.5. What Are the Main Steps in Fault Tree Analysis?
The principal steps include defining the top event, identifying contributing failures, constructing logical branches, analyzing failure combinations, and recommending improvements.
12.6. How Do You Create a Fault Tree Analysis Diagram?
Start with a clearly defined top event, identify its immediate causes, connect them with appropriate logic gates, and continue developing branches toward basic events.
12.7. What Is a Real-Life Example of Fault Tree Analysis?
A centrifugal pump failure investigation can examine motor faults, bearing seizure, suction restrictions, and other conditions causing inadequate discharge flow.
12.8. How Do You Calculate Failure Probability in a Fault Tree?
Apply probability equations to the Boolean relationships represented by the fault tree, considering event independence, dependencies, and shared causes.
12.9. What Is a Minimal Cut Set in Fault Tree Analysis?
A minimal cut set is the smallest combination of basic events sufficient to cause the defined top event.
12.10. What Is the Difference Between FTA and FMEA?
FTA starts with an unwanted system event and investigates its causes. FMEA starts with individual failure modes and examines their effects.
12.11. What Is the Difference Between Fault Tree Analysis and Root Cause Analysis?
FTA identifies possible logical failure pathways, while RCA generally investigates the underlying causes of an observed incident.
12.12. Is Fault Tree Analysis Qualitative or Quantitative?
FTA can be both. Qualitative analysis identifies failure combinations, while quantitative analysis estimates probabilities using reliability data.
12.13. What Are the Advantages and Disadvantages of Fault Tree Analysis?
Its advantages include systematic reasoning, clear visualization, and probability assessment. Limitations include extensive modeling requirements and dependence on reliable information.
12.14. Which Software Is Used for Fault Tree Analysis?
Common options include Isograph FaultTree+, ReliaSoft BlockSim, CAFTA, and selected open-source reliability modeling applications.
12.15. Can Fault Tree Analysis Be Used for Preventive Maintenance?
Yes. FTA identifies critical failure mechanisms and helps prioritize preventive maintenance, inspections, and condition-monitoring activities.
12.16. What Are the Limitations of Fault Tree Analysis?
Important limitations include incomplete failure identification, uncertain input data, modeling complexity, and difficulties representing certain dynamic dependencies.
13. Conclusion
13.1. Key Takeaways from Fault Tree Analysis
Fault Tree Analysis provides a structured method for identifying equipment failures, understanding their logical relationships, and assessing system vulnerabilities.
Its combination of graphical reasoning and probability evaluation makes it valuable across numerous engineering disciplines.
13.2. Importance of Understanding FTA Symbols and Steps
Correct interpretation of symbols, logic gates, and failure relationships is essential for producing technically meaningful fault trees.
A systematic procedure also improves consistency, traceability, and analytical reliability.
13.3. Applying Fault Tree Analysis to Real-World Equipment Failures
Industrial applications demonstrate how FTA converts complicated failure scenarios into identifiable causal pathways.
Engineers can use these findings to strengthen maintenance programs, improve equipment design, and address critical operational weaknesses.
13.4. Improving Industrial Safety, Reliability, and Maintenance Performance
Effective FTA supports proactive engineering decisions rather than purely reactive maintenance.
When integrated with credible failure data, technical expertise, and appropriate risk controls, it becomes a powerful instrument for improving equipment reliability, preventing industrial incidents, and sustaining operational performance .