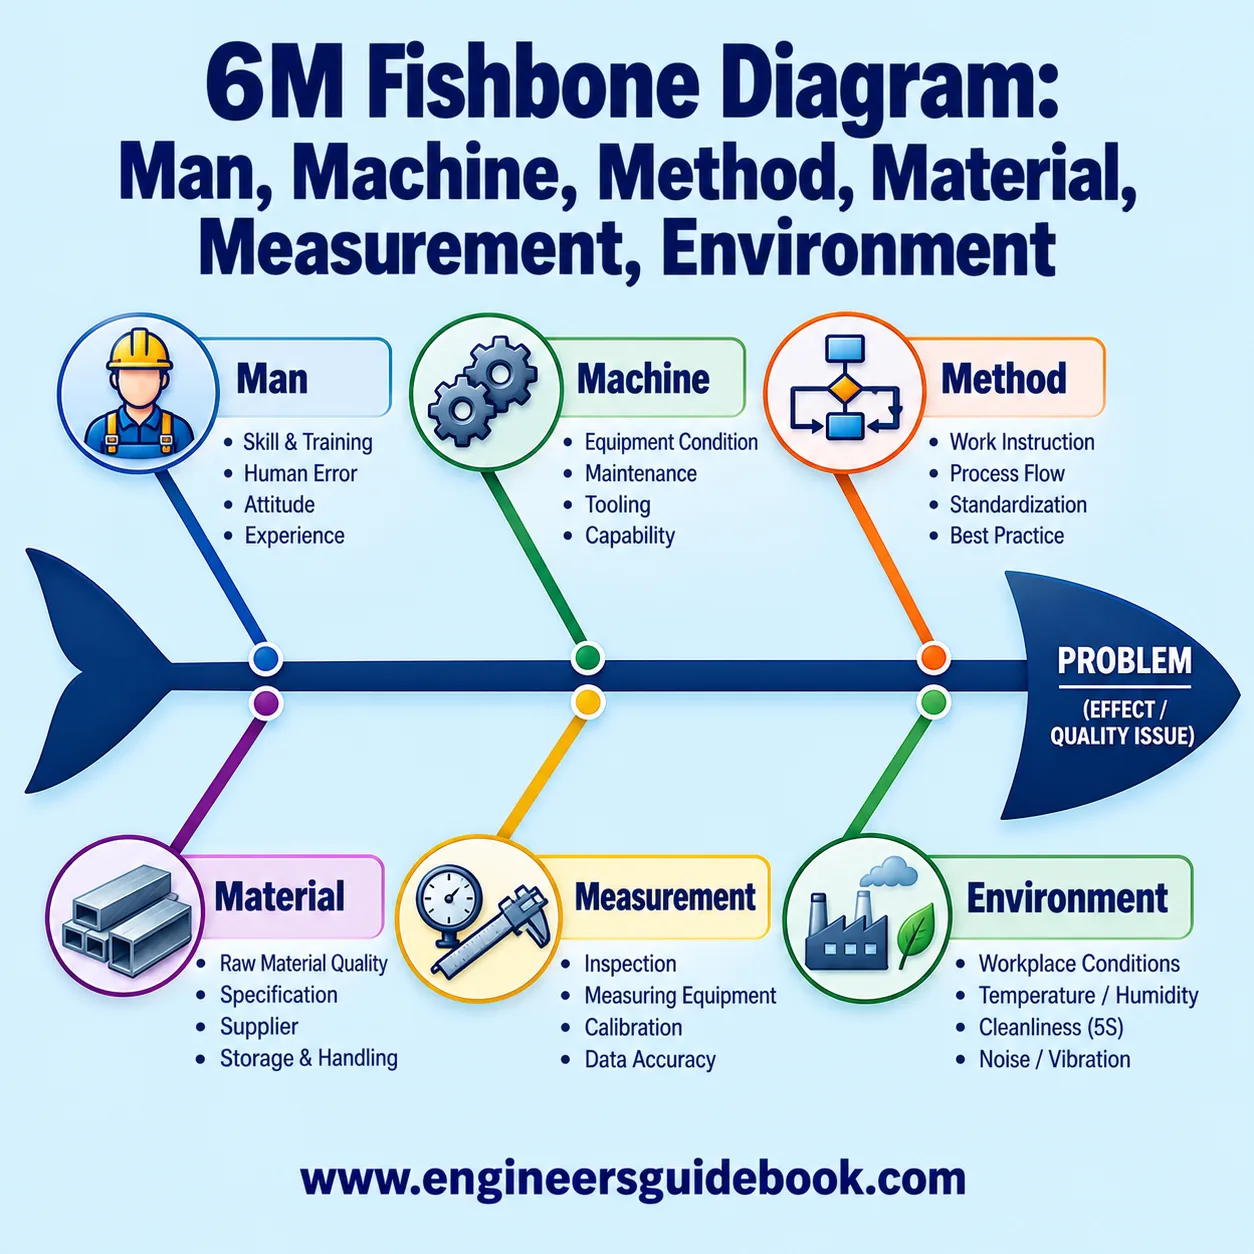
A 6M Fishbone Diagram is a root cause analysis tool that organizes potential causes of a problem into six categories: Man, Machine, Method, Material, Measurement, and Environment. It helps teams investigate process failures systematically, visualize cause-and-effect relationships, distinguish symptoms from underlying causes, and identify corrective actions based on evidence rather than assumptions.
1. 6M Fishbone Diagram Fundamentals
1.1 6M Fishbone Diagram Definition
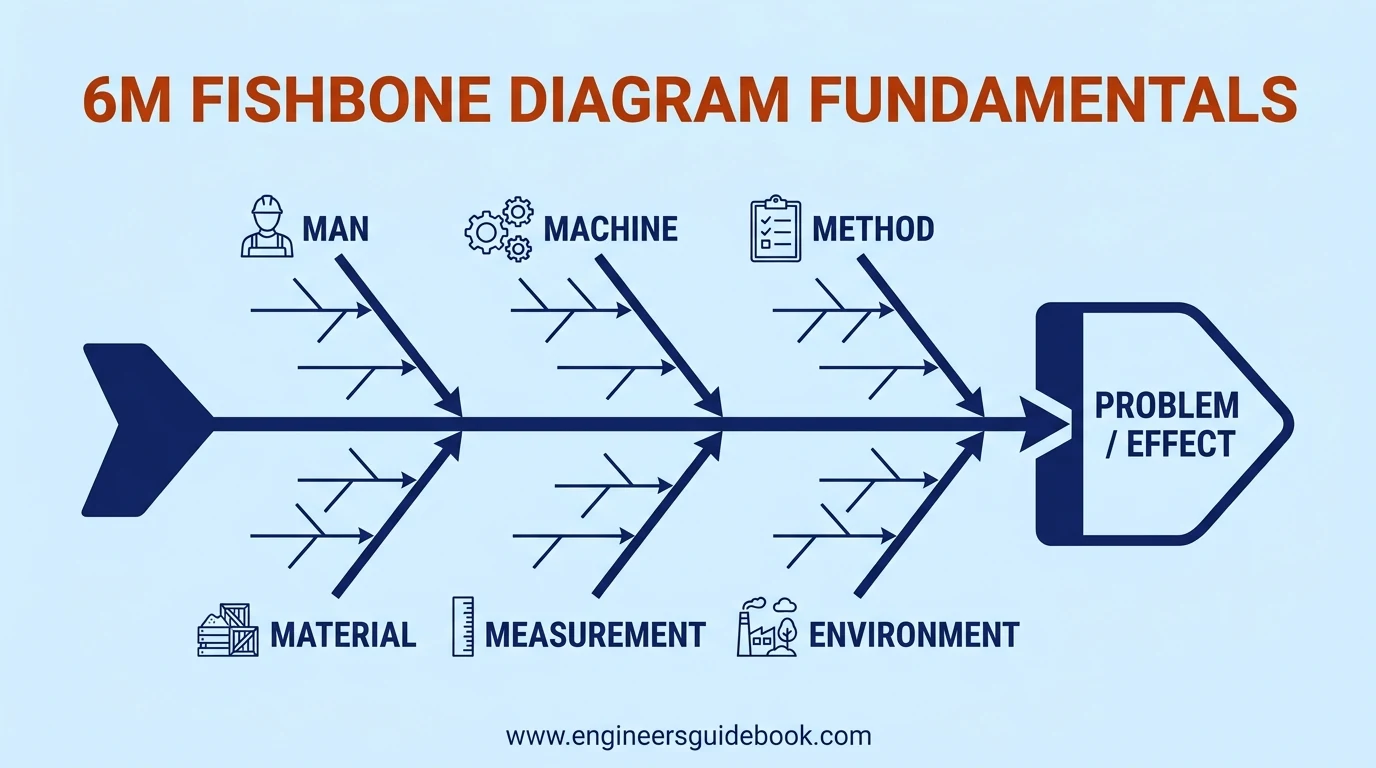
The 6M Fishbone Diagram is a structured cause-and-effect analysis technique used to identify, organize, and investigate potential causes of a specific problem. Its characteristic fishbone shape places the problem at the “head,” while major causal categories extend outward like skeletal branches.
The six traditional categories are Man, Machine, Method, Material, Measurement, and Environment . Each branch can be subdivided into increasingly specific contributing factors, enabling teams to move from a broad operational concern toward plausible root causes.
1.2 Purpose of the 6M Framework
The principal purpose of the 6M framework is to prevent problem-solving teams from concentrating prematurely on one suspected cause. Instead, it encourages multidimensional investigation.
A recurring production defect, for example, may initially appear to be an equipment problem. Further analysis might reveal that material inconsistency, improper operator technique, inaccurate measurement, or an inadequate procedure contributes equally to the failure.
This systematic categorization reduces tunnel vision and makes brainstorming more disciplined, comprehensive, and traceable.
1.3 Origins of Fishbone Analysis
Fishbone analysis is closely associated with Japanese quality expert Kaoru Ishikawa , whose cause-and-effect methodology became widely used in industrial quality management during the twentieth century.
For this reason, the fishbone diagram is also called an Ishikawa Diagram or Cause-and-Effect Diagram . Its visual simplicity helped quality teams convert complicated operational problems into understandable causal structures.
Over time, the methodology became integral to quality management, Lean manufacturing, Six Sigma, maintenance engineering, process improvement, and corrective action investigations.
1.4 Structure of a Fishbone Diagram
A fishbone diagram begins with a clearly defined problem statement positioned at the right side of the diagram. A horizontal line represents the main “spine.”
Six major branches then connect to the spine, representing the 6M categories. Secondary branches document suspected causes, while tertiary branches may explore deeper causal mechanisms.
The diagram should become progressively more specific. A branch such as “Machine” might include lubrication failure, bearing wear, incorrect alignment, sensor malfunction, or insufficient maintenance.
This hierarchical structure makes complex problems visually intelligible.
1.5 Relationship With Root Cause Analysis
The 6M Fishbone Diagram is not itself proof of root cause. Rather, it is an investigative framework used during root cause analysis .
Its purpose is to generate and organize hypotheses that can subsequently be tested using maintenance records, process data, inspections, interviews, measurements, experiments, or other evidence.
Techniques such as the 5 Whys , Pareto analysis, fault tree analysis, and statistical investigation can be combined with fishbone analysis to validate suspected causes.
A well-constructed fishbone diagram therefore initiates disciplined investigation rather than replacing verification.
1.6 Problems Best Suited to 6M Analysis
The 6M method is especially effective for multifactorial problems where several process elements may interact.
Typical applications include repetitive equipment breakdowns, quality defects, excessive scrap, production delays, process instability, high rejection rates, customer complaints, safety incidents, abnormal downtime, and inconsistent product performance.
It is particularly valuable when teams disagree about the cause because the framework encourages all credible possibilities to be documented before conclusions are reached.
2. Understanding the Six Categories
2.1 Man
The Man category addresses human factors influencing process performance. These may include competency, experience, attentiveness, communication, training, workload, supervision, and adherence to procedures.
Modern organizations sometimes replace “Man” with terms such as People or Manpower , but the analytical purpose remains the same.
The objective is not to blame individuals. Instead, teams should investigate why the system allowed human-related errors or inconsistencies to occur.
2.2 Machine
Machine factors encompass the equipment, tools, utilities, automation systems, and mechanical assets involved in a process.
Possible causes include worn components, incorrect settings, poor lubrication, inadequate maintenance, sensor failures, equipment deterioration, misalignment, excessive vibration, or insufficient capacity.
Because visible mechanical failures are often symptoms rather than ultimate causes, deeper investigation is necessary before attributing a problem exclusively to equipment.
2.3 Method
The Method category examines how work is performed.
It includes procedures, sequences, operating practices, maintenance methods, inspection protocols, setup routines, cleaning practices, and production standards.
A technically capable workforce and reliable machine can still generate poor results when methods are ambiguous, inconsistent, outdated, or poorly controlled.
Method-related causes frequently emerge when different operators perform the same activity differently.
2.4 Material
Material factors concern the physical inputs consumed or transformed during production.
Examples include raw materials, chemicals, lubricants, packaging components, spare parts, ingredients, and intermediate products.
Investigators should consider variations in composition, dimensions, contamination, supplier quality, storage conditions, shelf life, and specification conformity.
Even subtle material variability can create pronounced downstream effects in tightly controlled manufacturing processes.
2.5 Measurement
Measurement covers the systems used to quantify, inspect, monitor, and verify process performance.
Potential causes include inaccurate instruments, improper calibration, unsuitable sampling frequency, inconsistent inspection techniques, recording mistakes, and poorly defined tolerances.
A defective measurement system can produce misleading information. Consequently, teams may attempt to correct a process that is functioning properly or overlook a process that is genuinely unstable.
2.6 Environment
The Environment category addresses surrounding conditions that influence process behavior.
Typical factors include temperature, humidity, dust, vibration, lighting, ventilation, noise, workplace layout, cleanliness, and ambient contamination.
Environmental influences can be intermittent and therefore difficult to diagnose. A process might operate successfully during one shift or season but deteriorate when temperature, humidity, or surrounding conditions change.
2.7 Interaction Between the Six Categories
The six categories should not be treated as isolated compartments.
Many industrial failures result from interactions between several factors. An operator may use the wrong machine setting because a work instruction is unclear. A bearing may fail because inappropriate lubricant was supplied and the preventive maintenance interval was excessive.
Understanding these interdependencies is crucial. Effective root cause analysis examines the causal chain rather than selecting the first plausible branch.

3. Man Factors
3.1 Operator Skills
Operator competency directly affects process consistency. Insufficient technical skill can lead to incorrect setup, improper adjustments, delayed fault recognition, or unsuitable responses to abnormal conditions.
Competency matrices and practical evaluations can help determine whether personnel possess the required skills.
3.2 Training Gaps
Training gaps occur when employees have not received adequate instruction or when training fails to reflect current processes.
New equipment, revised procedures, modified products, and automation upgrades can rapidly make previous training obsolete. Refresher programs should therefore accompany meaningful operational changes.
3.3 Human Error
Human error should be investigated as a system phenomenon rather than accepted as a convenient conclusion.
Teams should determine why the error occurred. Poor interface design, inadequate instructions, excessive complexity, distraction, or missing safeguards may have enabled the mistake.
3.4 Fatigue and Workload
Excessive workload and prolonged working periods can impair concentration, judgment, reaction time, and precision.
Fatigue-related errors often become more frequent during overtime, night shifts, understaffing, or repetitive manual operations.
3.5 Communication Problems
Incorrect or incomplete communication can produce serious process deviations.
Shift handovers, maintenance instructions, production changes, quality alerts, and abnormal equipment observations should be communicated through defined channels rather than informal assumptions.
3.6 Staffing Levels
Insufficient staffing can cause delayed inspections, postponed maintenance, rushed work, and inadequate supervision.
Conversely, poorly coordinated staffing can generate unclear accountability and duplicated activity.
3.7 Roles and Responsibilities
Ambiguous responsibilities create gaps in ownership.
Teams should clearly establish who operates, inspects, maintains, approves, verifies, and escalates each critical activity.
3.8 Supervision and Leadership
Supervisory practices influence discipline, compliance, and problem escalation.
Weak oversight can normalize deviations, temporary fixes, procedural shortcuts, and recurring abnormalities that eventually become accepted as routine.

4. Machine Factors
4.1 Equipment Condition
Equipment condition includes mechanical integrity, cleanliness, wear, corrosion, lubrication status, alignment, and general serviceability.
Routine inspections can reveal deterioration before it develops into functional failure.
4.2 Mechanical Failures
Mechanical failures may involve bearings, seals, shafts, couplings, gearboxes, chains, belts, pumps, valves, or structural components.
Investigators should determine the underlying failure mechanism rather than simply replacing the damaged part.
4.3 Preventive Maintenance
Inadequate preventive maintenance can allow predictable deterioration to progress unnoticed.
Maintenance intervals should reflect equipment criticality, operating hours, historical failures, manufacturer guidance, and actual operating conditions.
4.4 Machine Settings
Incorrect temperature, pressure, speed, torque, timing, clearance, or alignment settings can destabilize a process.
Critical settings should therefore be standardized and protected against unauthorized alteration.
4.5 Tooling Problems
Worn, damaged, unsuitable, or incorrectly installed tooling can produce dimensional errors and inconsistent output.
Tool life and replacement criteria should be established objectively.
4.6 Equipment Capacity
Operating equipment continuously beyond its intended capacity can accelerate wear and compromise process stability.
Capacity analysis should consider peak demand rather than nominal averages alone.
4.7 Automation and Controls
PLC logic, sensors, actuators, interlocks, drives, and control loops can introduce failures that are less visually obvious than mechanical defects.
Diagnostic data can be invaluable when investigating intermittent automation problems.
4.8 Machine Reliability
Machine reliability reflects the probability that equipment will perform its required function consistently.
Metrics such as MTBF , MTTR , failure frequency, and downtime history help identify chronic reliability weaknesses.

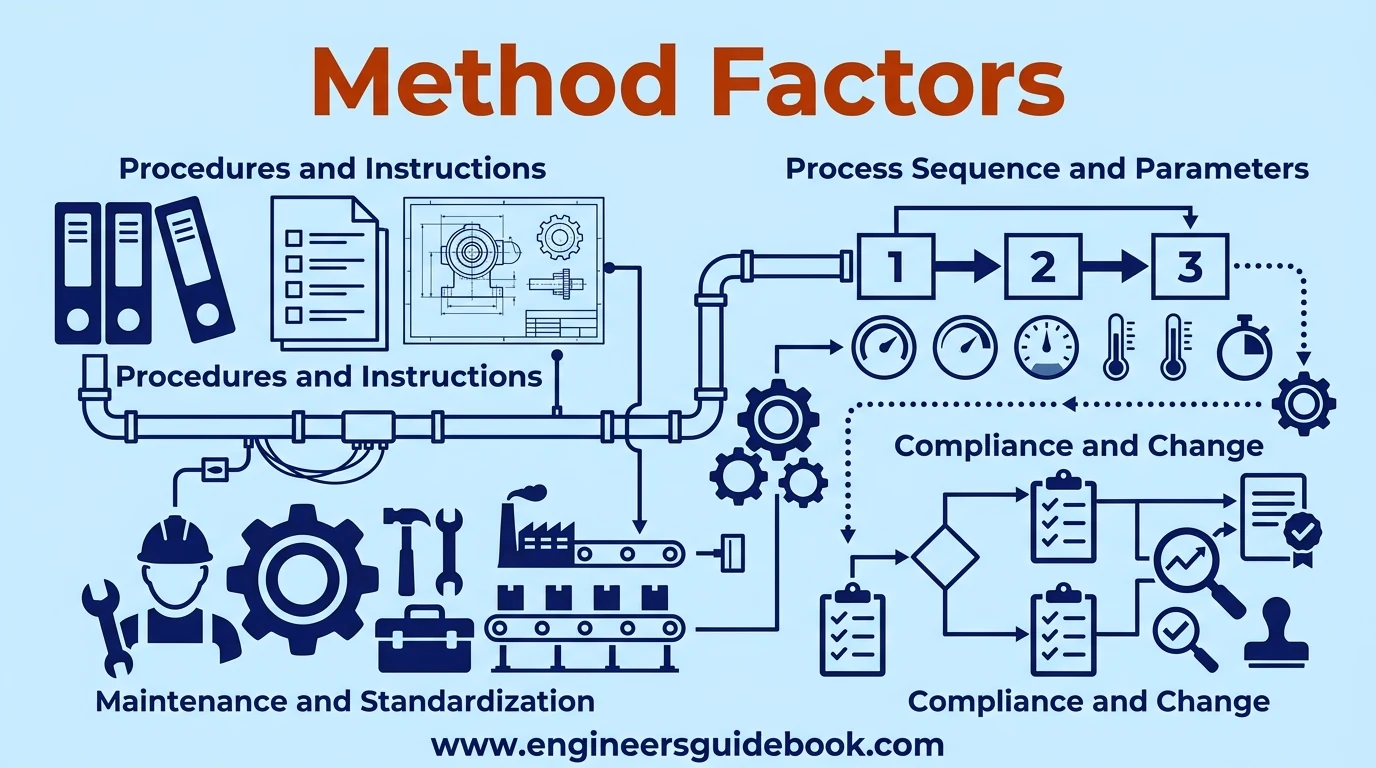
5. Method Factors
5.1 Standard Operating Procedures
Standard operating procedures establish the approved method for performing critical activities.
They should be accurate, accessible, concise, and aligned with actual plant practices.
5.2 Work Instructions
Work instructions provide task-level detail.
Poorly written instructions can create interpretation differences, particularly during setup, maintenance, inspection, and changeover activities.
5.3 Process Sequence
Incorrect process sequencing can introduce defects even when each individual activity is performed correctly.
Sequence dependencies should therefore be explicitly controlled.
5.4 Operating Parameters
Operating parameters define acceptable process conditions.
Uncontrolled variation in speed, temperature, pressure, time, concentration, or flow can cause instability.
5.5 Maintenance Procedures
Maintenance quality depends heavily on standardized execution.
Improper assembly, tightening, lubrication, alignment, or testing can create latent failures after maintenance is completed.
5.6 Process Standardization
Standardization reduces unnecessary variation between operators, shifts, production lines, and locations.
Without standardization, identifying abnormal performance becomes considerably more difficult.
5.7 Change Management
Process modifications should be reviewed before implementation.
Uncontrolled changes to materials, equipment, settings, suppliers, or procedures can introduce unexpected hazards and quality problems.
5.8 Procedure Compliance
Even well-designed procedures are ineffective when routinely bypassed.
Investigators should establish whether noncompliance results from poor discipline, impractical requirements, inadequate training, or operational pressure.
6. Material Factors
6.1 Raw Material Quality
Raw material quality strongly influences final output.
Variation in chemical composition, dimensions, moisture, strength, purity, or physical characteristics can alter process behavior.
6.2 Material Specifications
Specifications define acceptable material characteristics.
Requirements that are vague, incomplete, or excessively broad can permit unsuitable materials to enter the process.
6.3 Supplier Variability
Different suppliers may provide technically compliant materials that perform differently in production.
Supplier performance should therefore be monitored using both incoming inspection and actual process results.
6.4 Material Handling
Incorrect handling can damage otherwise acceptable materials.
Dropping, crushing, mixing, exposure, improper transfer, or unsuitable containers can introduce defects before production begins.
6.5 Storage Conditions
Temperature, humidity, sunlight, contamination, and storage duration may change material properties.
Sensitive materials require clearly defined storage controls.
6.6 Contamination Risks
Contamination may arise from dust, moisture, chemicals, foreign particles, incompatible products, or inadequate cleaning.
Cross-contamination is especially important in food, chemical, pharmaceutical, and personal-care processes.
6.7 Material Substitution
Substituting materials without technical evaluation can alter product quality or equipment behavior.
Equivalent appearance does not guarantee equivalent performance.
6.8 Packaging and Components
Defective containers, caps, labels, seals, cartons, or other packaging components can create failures even when the primary product is satisfactory.
Packaging materials should therefore be incorporated into root cause investigations.

7. Measurement Factors
7.1 Measurement Accuracy
Accurate measurement is essential for reliable decision-making.
An inaccurate instrument can conceal true process variation or falsely indicate defects.
7.2 Calibration Problems
Calibration verifies that instruments produce results within acceptable uncertainty.
Expired calibration, improper reference standards, or damaged devices can compromise process control.
7.3 Inspection Methods
Different inspection techniques may produce inconsistent conclusions.
Inspection methods should specify equipment, procedure, acceptance criteria, and environmental conditions.
7.4 Sampling Techniques
Poor sampling can produce misleading results even when measurements themselves are accurate.
Samples must represent the actual population or process condition being evaluated.
7.5 Data Collection
Incomplete, delayed, manually altered, or incorrectly recorded data can obstruct root cause analysis.
Data collection systems should emphasize traceability and consistency.
7.6 Instrument Reliability
Measurement instruments can drift, fail intermittently, or respond poorly under actual operating conditions.
Instrument health should therefore be considered alongside calibration status.
7.7 Measurement System Analysis
Measurement System Analysis evaluates whether the measurement process itself is sufficiently capable.
Techniques such as Gauge R&R can quantify repeatability and reproducibility before process conclusions are drawn.
7.8 Reporting Errors
Accurate measurements can still become misleading when reported incorrectly.
Transcription mistakes, wrong units, spreadsheet errors, incorrect rounding, or improper classification may distort the apparent performance of a process.

8. Environment Factors
8.1 Temperature
Temperature can influence machinery, materials, measurement accuracy, and human performance. Excessive heat may accelerate lubricant degradation, alter material viscosity, distort components, or affect electronic equipment. Low temperatures can increase brittleness or reduce process efficiency.
During a fishbone investigation, teams should examine whether temperature remains within the required operating range and whether deviations correlate with defects, downtime, or process instability.
8.2 Humidity
Humidity can affect hygroscopic materials, electrical systems, packaging, corrosion rates, and product quality. Excessive moisture may cause swelling, condensation, oxidation, or adhesion problems, while very low humidity can promote static electricity.
Seasonal changes should also be considered because humidity-related failures may appear intermittently rather than continuously.
8.3 Dust and Contamination
Dust, foreign particles, oil mist, chemical residue, and airborne contamination can degrade both products and equipment.
Contaminants may clog filters, interfere with sensors, damage bearings, contaminate raw materials, or create cosmetic defects. Effective housekeeping, sealing, filtration, and zoning are therefore important environmental controls.
8.4 Lighting
Poor lighting can increase inspection errors, incorrect assembly, missed defects, and unsafe working practices.
Lighting analysis should consider intensity, glare, shadows, flickering, and whether critical tasks receive sufficient illumination. Visual inspection processes are particularly vulnerable to inconsistent lighting conditions.
8.5 Noise and Vibration
Excessive noise can reduce concentration and interfere with communication, while vibration can affect machines, instruments, structures, and product quality.
Uncontrolled vibration may loosen fasteners, damage bearings, disturb measurement devices, or generate recurring mechanical failures. Both factors should be evaluated when investigating intermittent problems.
8.6 Workplace Layout
A poorly designed workplace can create excessive movement, material congestion, unsafe access, cross-traffic, and inefficient process flow.
Layout problems may also increase handling damage and delay communication between interconnected operations. Fishbone analysis should therefore consider whether physical arrangement contributes to the observed effect.
8.7 Ventilation
Ventilation influences temperature, airborne contaminants, fumes, moisture, and employee comfort.
Insufficient ventilation can produce localized heat accumulation or hazardous atmospheres, while excessive airflow may introduce dust or disturb sensitive processes. Ventilation performance should match process and safety requirements.
8.8 External Operating Conditions
External conditions include utility fluctuations, weather, upstream process disturbances, supplier interruptions, and changes in surrounding operations.
These factors are often overlooked because they originate outside the immediate process boundary. However, they may significantly influence output and should be included whenever evidence suggests external dependence.

9. Creating a 6M Fishbone Diagram
9.1 Define the Problem
Begin with a precise and measurable problem.
Statements such as “quality is poor” are too vague. A stronger statement would identify the product, defect, location, frequency, and timeframe. Clear problem definition prevents teams from investigating unrelated issues.
9.2 Write the Effect Statement
The effect statement should describe the specific outcome being investigated.
It is normally written at the head of the fishbone diagram and must remain concise. The statement should describe what is happening without prematurely suggesting why it is happening.
9.3 Draw the Fishbone Structure
Draw a horizontal line pointing toward the effect statement.
This line forms the central spine. Diagonal branches are then added to create the visual structure that will organize possible causes.
9.4 Add the Six Main Branches
Label the major branches as Man, Machine, Method, Material, Measurement, and Environment .
These six categories create a systematic checklist that discourages investigators from concentrating only on familiar or obvious causes.
9.5 Brainstorm Possible Causes
Gather a cross-functional team and generate potential causes for each category.
At this stage, the objective is breadth rather than immediate judgment. Operators, engineers, maintenance personnel, quality specialists, and supervisors may each identify different causal possibilities.
9.6 Add Secondary Causes
Each primary cause can be divided into more specific contributing factors.
For example, “poor maintenance” may branch into incorrect lubrication, missed inspections, inadequate spare parts, and unsuitable maintenance intervals. This decomposition exposes deeper causal mechanisms.
9.7 Ask Why Repeatedly
The 5 Whys technique can be applied to significant fishbone branches.
Repeatedly asking why a condition exists helps move beyond visible symptoms. The number five is not rigid; questioning should continue until the underlying controllable mechanism becomes clear.
9.8 Validate Suspected Causes
Potential causes must be verified using evidence.
Maintenance history, production records, calibration data, inspection results, interviews, experiments, and trend analysis can distinguish genuine causes from speculation. A fishbone diagram without validation remains only a hypothesis map.
9.9 Prioritize Root Causes
Not every identified cause deserves equal attention.
Teams should prioritize causes according to impact, frequency, probability, controllability, and supporting evidence. Pareto analysis or risk ranking can support this decision.
9.10 Document Corrective Actions
Confirmed root causes should be connected to specific corrective actions.
Each action should include responsibility, completion date, verification method, and expected outcome. Documentation converts analysis into accountable improvement.

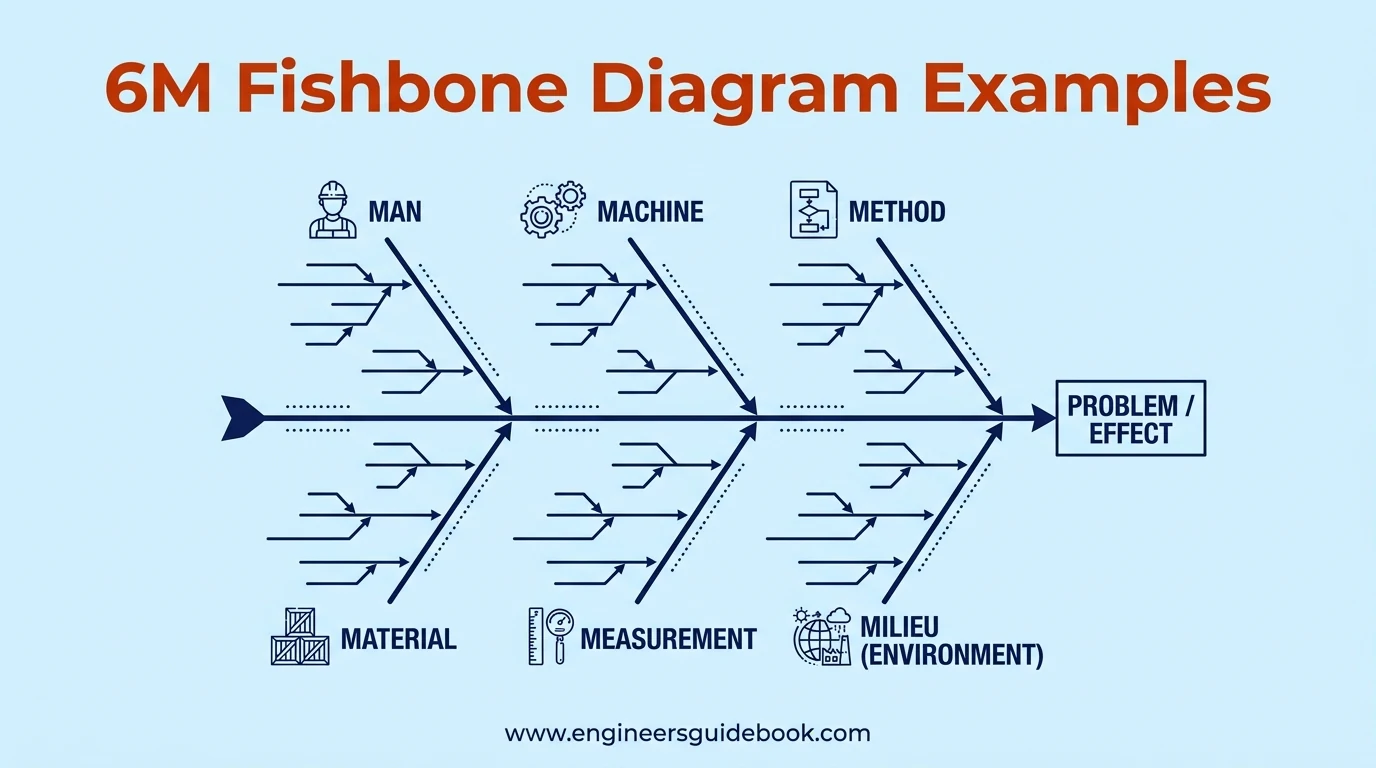
10. 6M Fishbone Diagram Examples
10.1 Production Downtime
For recurring downtime, Man factors might include delayed operator response, Machine factors could include bearing failures, and Method factors may involve poor startup procedures.
Material shortages, inaccurate instrumentation, and high ambient temperature may also contribute.
10.2 Product Defects
A defective product could originate from insufficient training, unstable machinery, incorrect process parameters, inconsistent raw material, measurement error, or unsuitable environmental conditions.
The 6M framework helps examine all these dimensions simultaneously.
10.3 Machine Breakdown
A machine breakdown may appear purely mechanical, yet deeper causes could include improper maintenance methods, unsuitable spare parts, operator misuse, inaccurate condition monitoring, or environmental contamination.
10.4 Low Production Output
Low output can result from slow equipment, excessive changeovers, workforce shortages, substandard material, poor scheduling, or inaccurate production measurements.
The fishbone diagram prevents premature attribution to machine speed alone.
10.5 Quality Rejection
Quality rejection may stem from dimensional variation, incorrect inspection criteria, operator inconsistency, material defects, unstable process conditions, or calibration drift.
Validation should determine which factors actually correlate with rejected batches.
10.6 Packaging Failure
Packaging failures may involve weak containers, incorrect sealing settings, unsuitable temperature, damaged tooling, improper handling, or inadequate inspection.
Multiple factors can interact and produce the same visible defect.
10.7 Maintenance Problems
Repeated maintenance failures may originate from poor planning, incomplete procedures, technician skill gaps, wrong spare parts, insufficient diagnostic equipment, or inaccessible equipment layout.
10.8 Safety Incidents
For safety incidents, the 6M framework can explore competency, equipment safeguards, work methods, hazardous materials, monitoring systems, and workplace conditions.
The analysis should focus on systemic causes rather than individual blame.
10.9 Customer Complaints
Customer complaints can be traced through production, inspection, packaging, storage, and delivery processes.
A fishbone approach helps identify whether complaints originate from process variation, handling problems, incorrect specifications, or measurement deficiencies.
10.10 Process Variability
Process variability often arises from several interacting sources.
Machine wear, operator technique, raw material variation, measurement uncertainty, environmental changes, and inconsistent methods can collectively increase variation beyond acceptable limits.
11. Best Practices and Common Mistakes
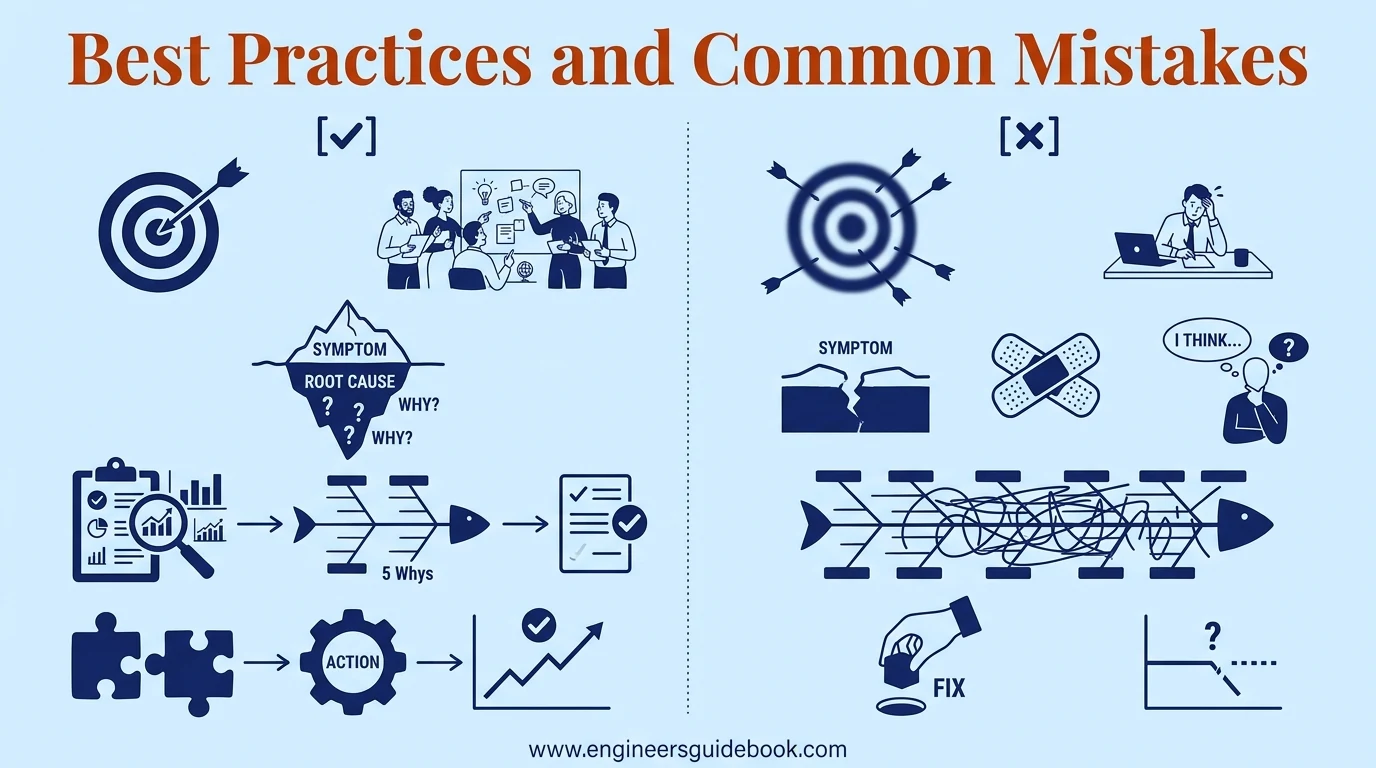
11.1 Use Specific Problem Statements
A specific problem statement narrows the investigation and improves cause relevance.
Avoid broad descriptions that combine multiple defects or unrelated effects.
11.2 Involve Cross Functional Teams
Cross-functional participation increases analytical depth.
Different departments observe different portions of the process, making collective analysis more comprehensive than single-person investigation.
11.3 Separate Symptoms From Causes
A symptom describes what is observed; a cause explains why it occurs.
Repeatedly replacing a failed bearing, for instance, does not address misalignment or inadequate lubrication that may be causing the failure.
11.4 Avoid Assumptions
Do not accept plausible explanations merely because they sound logical.
Every critical cause should be supported by data, direct observation, testing, or credible evidence.
11.5 Use Evidence Based Validation
Evidence-based validation is what transforms brainstorming into root cause analysis.
Trend data, controlled experiments, failure records, and inspections are more reliable than intuition alone.
11.6 Avoid Overloading Categories
A diagram containing dozens of loosely related items can become difficult to interpret.
Combine duplicates, remove irrelevant speculation, and focus deeper analysis on plausible causal pathways.
11.7 Prioritize High Impact Causes
Resources should be directed toward causes that materially influence the problem.
High-impact causes usually offer greater improvement potential than minor peripheral factors.
11.8 Combine Fishbone With 5 Whys
Fishbone analysis identifies where potential causes may exist, while the 5 Whys explores why those causes exist.
Used together, these techniques produce deeper and more structured investigations.
11.9 Link Causes to Corrective Actions
Corrective actions should directly address validated root causes.
Generic actions such as “retrain operators” are ineffective when the actual cause lies in machine design or defective material.
11.10 Review Effectiveness After Implementation
Corrective action is incomplete until its effectiveness is verified.
Teams should monitor relevant KPIs, recurrence rates, quality results, or downtime trends to determine whether the problem has actually been eliminated.
12. Frequently Asked Questions
12.1 What Are the 6M Categories in a Fishbone Diagram
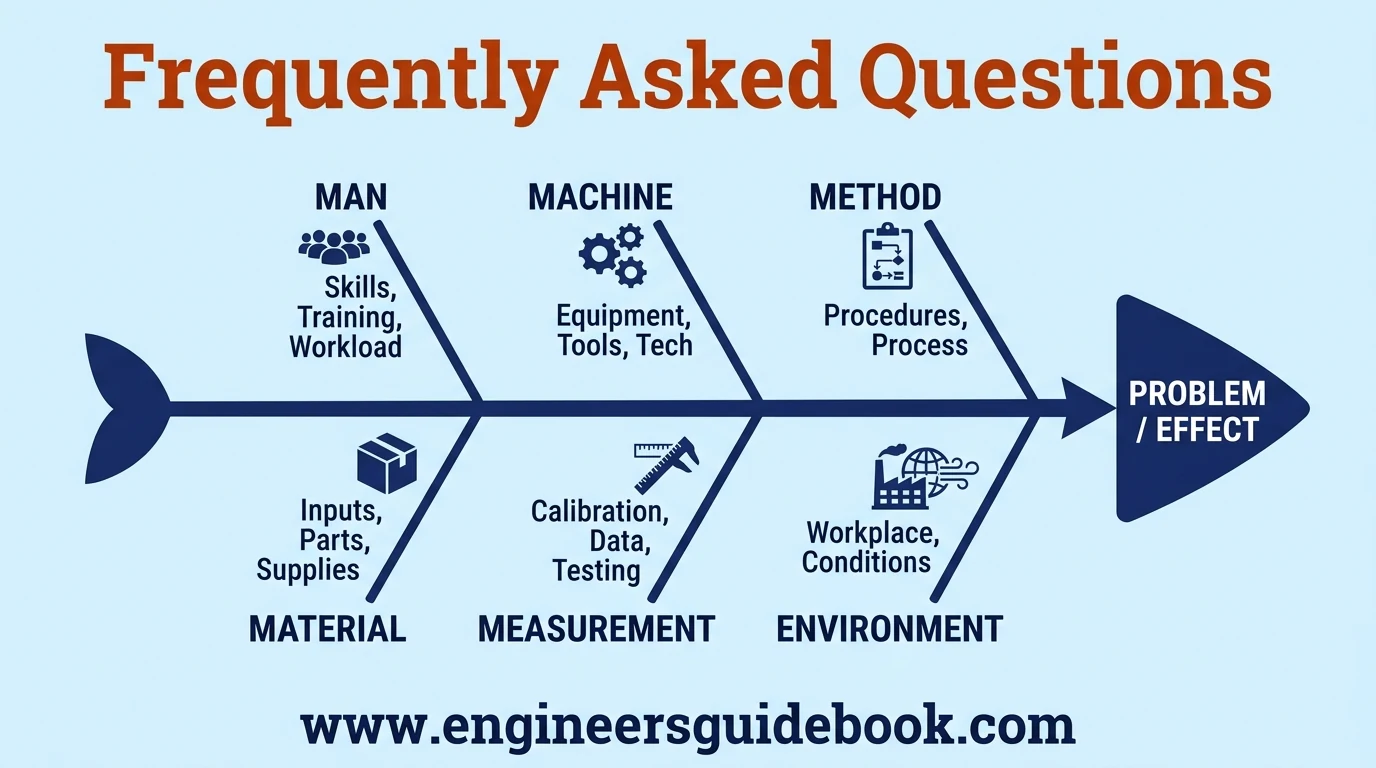
The six categories are Man, Machine, Method, Material, Measurement, and Environment . They provide a structured framework for identifying possible causes of a process problem.
12.2 What Does Man Mean in a Fishbone Diagram
Man refers to human-related factors such as skills, training, communication, workload, experience, supervision, and procedural compliance.
12.3 What Does Machine Mean in a Fishbone Diagram
Machine covers equipment, tools, automation, mechanical condition, maintenance, settings, capacity, and reliability.
12.4 What Does Method Mean in a Fishbone Diagram
Method refers to the procedures, work instructions, process sequences, operating practices, and standardized techniques used to perform work.
12.5 What Does Material Mean in a Fishbone Diagram
Material includes raw materials, components, consumables, packaging, spare parts, and other physical inputs that can influence process results.
12.6 What Does Measurement Mean in a Fishbone Diagram
Measurement includes inspection methods, instruments, calibration, sampling, data collection, tolerances, and measurement-system accuracy.
12.7 What Does Environment Mean in a Fishbone Diagram
Environment represents surrounding conditions such as temperature, humidity, dust, noise, vibration, ventilation, lighting, and workplace layout.
12.8 How Do You Create a 6M Fishbone Diagram
Define the problem, draw the fishbone structure, add the six categories, brainstorm causes, explore secondary causes, validate them with evidence, and prioritize confirmed root causes.
12.9 What Is the Difference Between 6M and Fishbone Analysis
Fishbone analysis is the broader cause-and-effect methodology. The 6M model is a specific fishbone format that organizes potential causes into six predefined categories.
12.10 When Should a 6M Fishbone Diagram Be Used
It is useful when a problem may have multiple interacting causes, particularly in manufacturing, maintenance, quality, safety, and process-improvement investigations.
12.11 Can the 6M Fishbone Diagram Be Used Outside Manufacturing
Yes. The framework can be adapted for logistics, healthcare, administration, services, laboratories, construction, and other process-based activities.
12.12 How Does the 6M Fishbone Diagram Support Root Cause Analysis
It creates a disciplined structure for identifying, organizing, questioning, and validating possible causes before corrective actions are selected.
13. Conclusion
The 6M Fishbone Diagram offers a practical framework for examining problems through six complementary perspectives. Its value lies in systematic investigation rather than visual presentation alone.
Effective root cause identification requires evidence, questioning, and validation. The fishbone diagram helps teams move beyond symptoms and organize causal possibilities before determining which factors genuinely drive the problem.
The 6M methodology supports corrective action, reliability improvement, quality management, Lean initiatives, and continuous improvement. When used consistently, it creates a repeatable problem-solving discipline that helps organizations eliminate recurring failures instead of repeatedly managing their consequences.