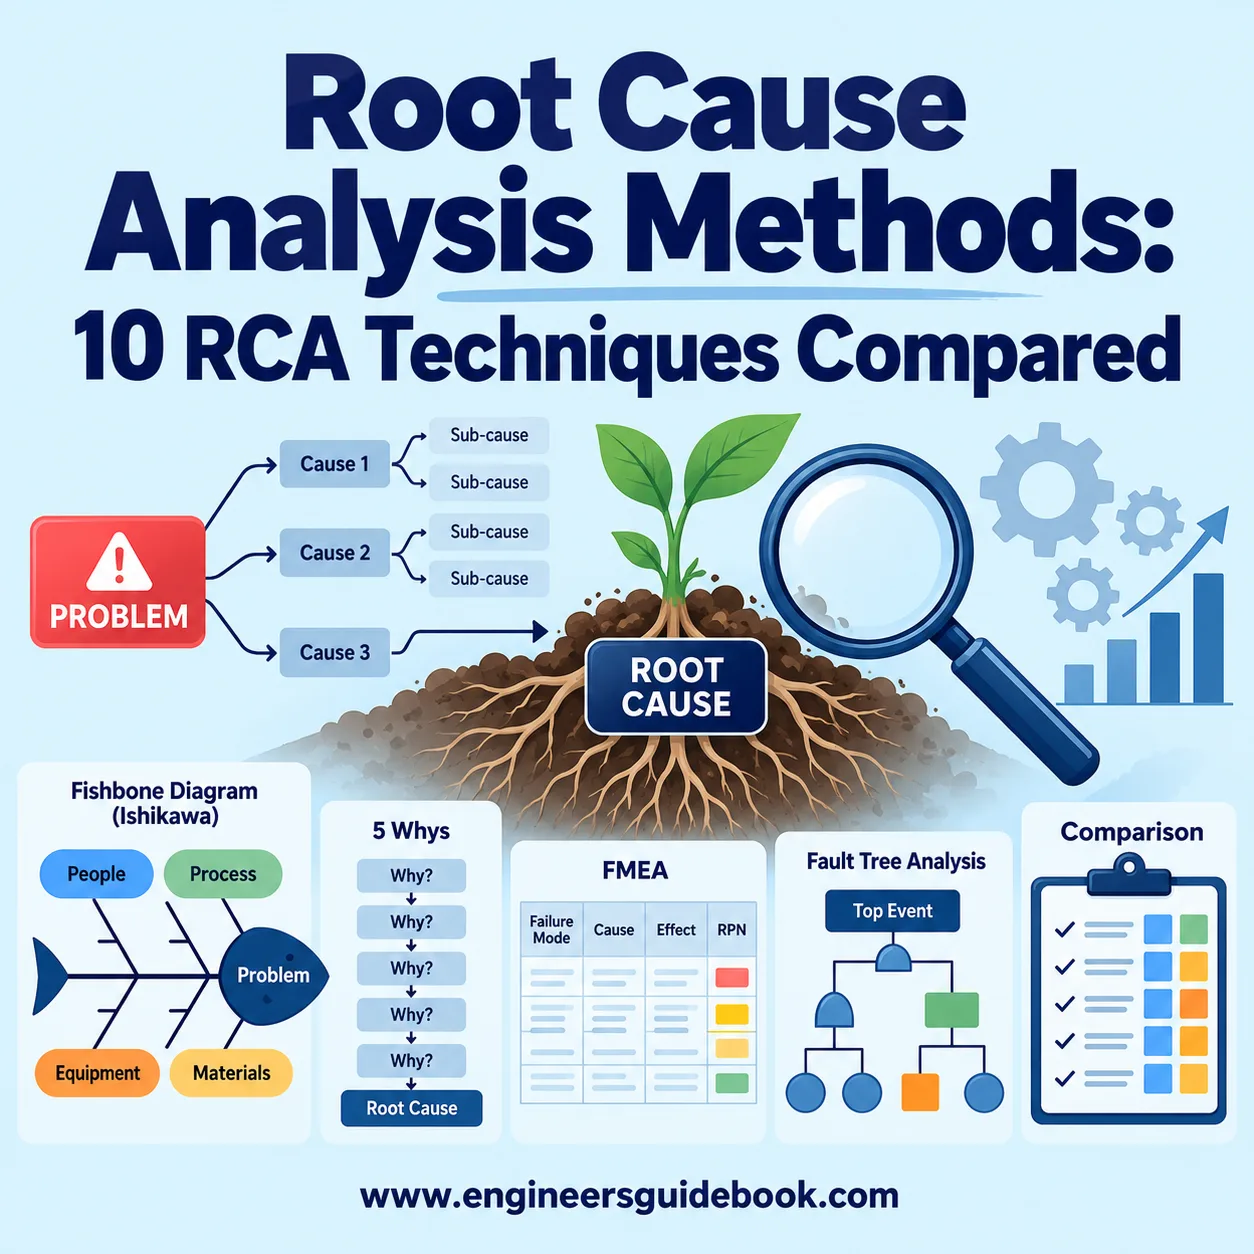
Root cause analysis methods help organizations identify the underlying reasons problems occur instead of repeatedly treating symptoms. Common RCA techniques include Five Whys, Fishbone Diagrams, Fault Tree Analysis, FMEA, and Pareto Analysis. Each method approaches failure differently, from simple questioning to structured risk analysis, allowing teams to select the most appropriate technique for equipment failures, quality defects, safety incidents, and process problems.
1. Root Cause Analysis Methods
Root cause analysis methods are structured techniques used to investigate why an undesirable event occurred and determine what must change to prevent recurrence. Effective RCA goes beyond identifying the component, person, or process immediately associated with failure. It examines the causal chain behind the event.
Different RCA techniques provide different levels of analytical depth. A minor repetitive defect may require only a Five Whys investigation, while a complex system failure involving several interacting conditions may justify Fault Tree Analysis or FMEA.
1.1 Root Cause Analysis Definition
Root Cause Analysis, commonly abbreviated as RCA, is a systematic problem-solving discipline used to identify the fundamental causes responsible for failures, defects, incidents, or undesirable outcomes.
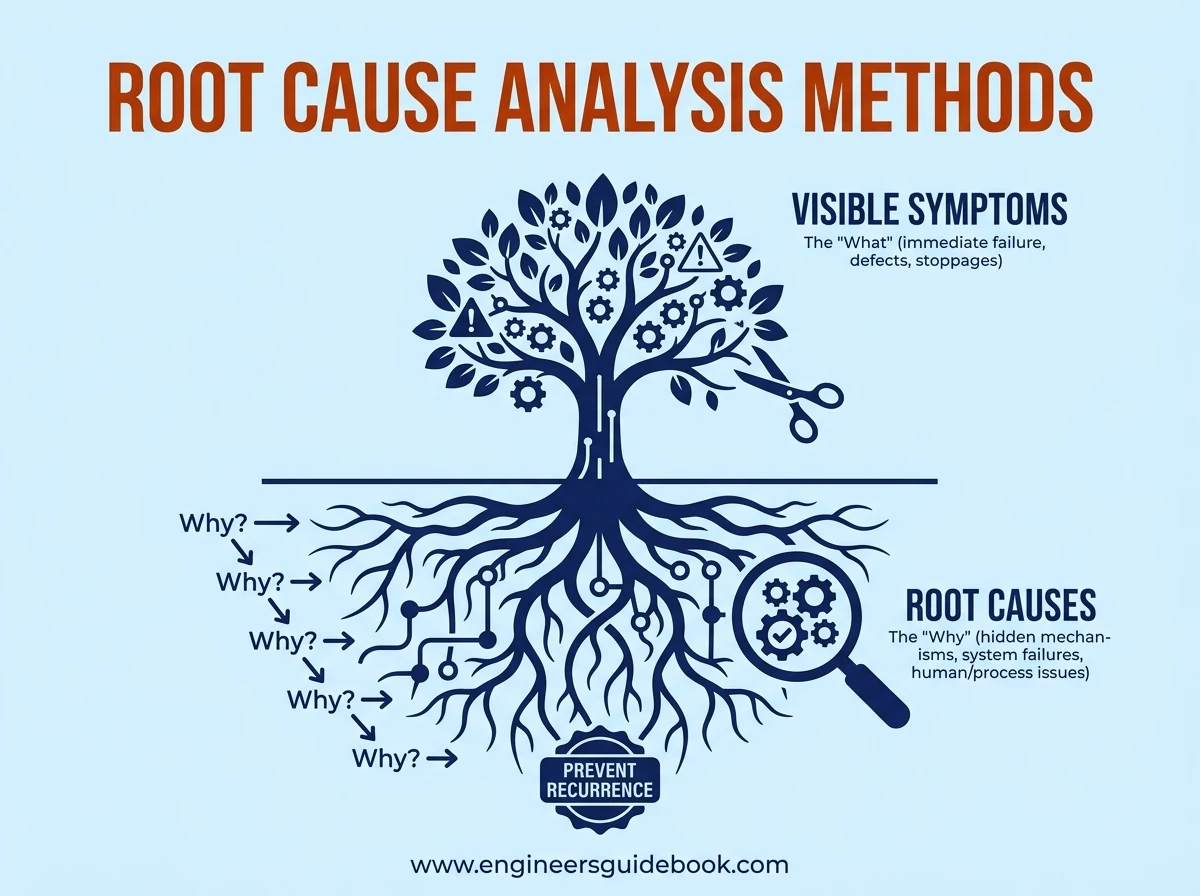
The central distinction lies between a symptom and a root cause . Replacing a failed bearing, for example, addresses the immediate failure. Determining that improper lubrication, shaft misalignment, or incorrect installation caused repeated bearing damage addresses the underlying mechanism.
A useful root cause should therefore explain not only what failed, but why the conditions allowing the failure existed.
1.2 Root Cause Analysis Purpose
The primary purpose of RCA is recurrence prevention.
Organizations frequently lose time by correcting visible symptoms without addressing the causal architecture underneath them. A machine may repeatedly overheat, products may continue failing inspection, or safety incidents may recur despite corrective maintenance.
RCA attempts to break this cycle by establishing causal relationships and identifying corrective actions that remove or control the actual source of the problem.
1.3 Root Cause Analysis Benefits
A well-executed RCA program can improve reliability, quality, safety, and operational efficiency simultaneously.
Key benefits include reduced repeat failures, lower maintenance costs, improved equipment availability, better process capability, and stronger organizational learning. RCA also helps prevent indiscriminate corrective actions because decisions are supported by evidence rather than conjecture.
For maintenance departments, fewer recurring breakdowns can improve MTBF and reduce emergency maintenance. In quality systems, RCA can reduce defect repetition and strengthen CAPA effectiveness.
1.4 Root Cause Analysis Applications
Root cause analysis is used across manufacturing, engineering, healthcare, construction, logistics, information technology, energy, and numerous process industries.
Typical applications include machinery breakdowns, production stoppages, safety incidents, customer complaints, product defects, excessive scrap, environmental events, utility failures, process deviations, and recurring maintenance jobs.
RCA is particularly valuable when a problem is repetitive, expensive, safety-critical, or operationally disruptive.
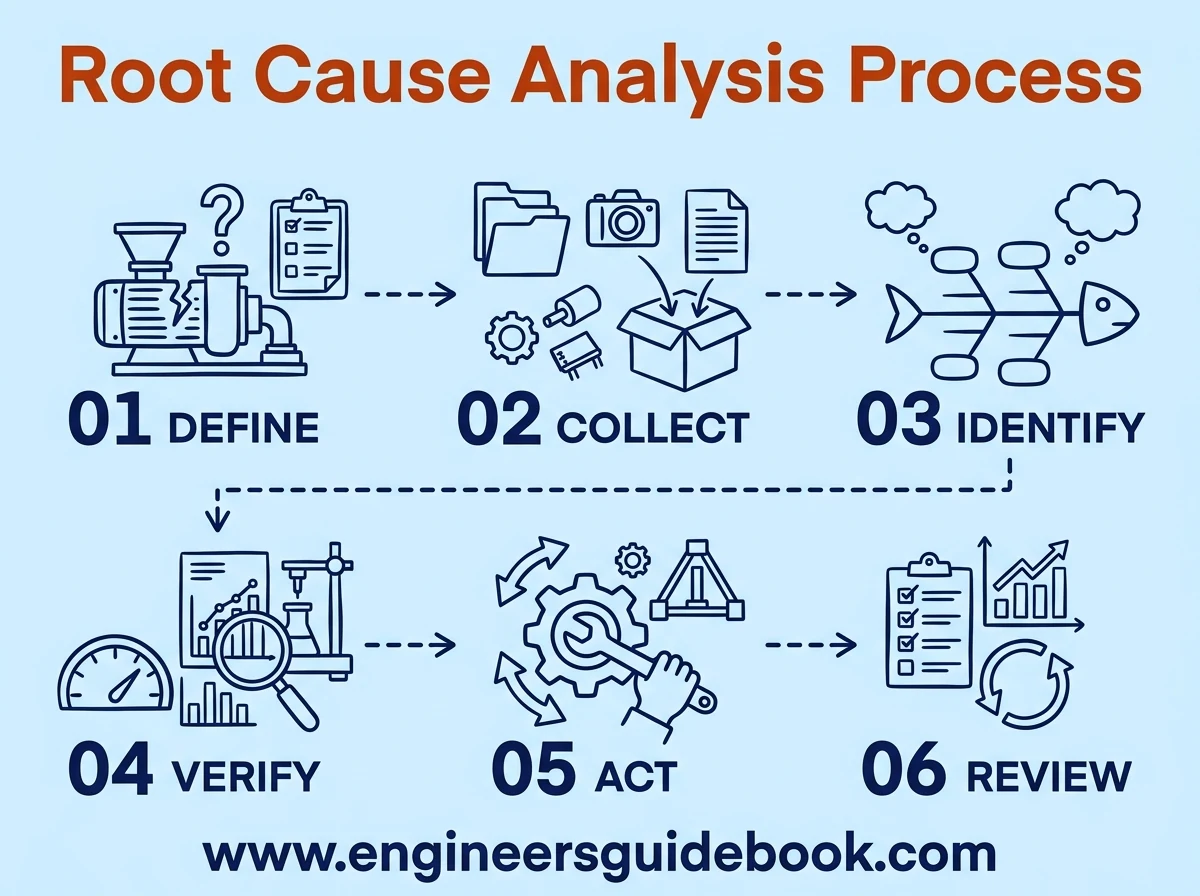
2. Root Cause Analysis Process
Regardless of the technique selected, most RCA investigations follow a broadly similar sequence.
The investigation begins by defining the problem accurately, gathering reliable evidence, developing possible causes, verifying them, implementing corrective actions, and finally confirming that those actions actually prevented recurrence.
Skipping any of these stages can weaken the investigation.
2.1 Problem Definition
A precise problem statement establishes the boundary of the investigation.
Instead of writing “pump failure,” investigators should describe what happened in measurable terms. A stronger statement might specify that a centrifugal pump experienced repeated mechanical seal leakage after approximately 300 operating hours.
Useful problem definitions normally answer what happened, where it occurred, when it occurred, how frequently it occurs, and what operational impact resulted.
Poorly defined problems generate diffuse investigations.
2.2 Evidence Collection
Evidence should be collected before assumptions harden into conclusions.
Relevant information may include maintenance records, inspection reports, photographs, operator statements, alarm histories, sensor trends, process parameters, failed components, laboratory results, work orders, and historical failure data.
Physical evidence is particularly important because memory can be incomplete or biased.
Where possible, failed parts should be preserved until the investigation is complete.
2.3 Cause Identification
Once evidence is assembled, investigators develop plausible causal factors.
At this stage, techniques such as Five Whys, Fishbone Analysis, Fault Tree Analysis, brainstorming, and event sequencing can help reveal relationships that are not initially obvious.
Possible causes should remain hypotheses until supported by evidence. Prematurely selecting a favored explanation introduces confirmation bias and can cause important alternatives to be overlooked.
2.4 Root Cause Verification
A suspected cause becomes credible only when it can be demonstrated logically or empirically.
Investigators should ask whether removing the suspected cause would reasonably prevent recurrence. They should also determine whether available evidence supports the proposed relationship.
Verification may involve testing, measurements, dimensional checks, material analysis, controlled trials, trend analysis, or comparison with normal operating conditions.
Correlation alone is insufficient.
2.5 Corrective Action
Corrective actions should address verified causes rather than convenient symptoms.
Actions may involve design modification, revised maintenance practices, process controls, training, automation, equipment protection, inspection improvements, procedural changes, or supplier correction.
The strongest corrective actions reduce dependence on human memory and create systemic safeguards.
Simply instructing personnel to “be more careful” is rarely a robust engineering control.
2.6 Effectiveness Review
Closing an RCA immediately after implementing corrective action is a common mistake.
The solution must be monitored long enough to confirm effectiveness. Relevant measures may include recurrence frequency, downtime, defect rate, alarm frequency, maintenance cost, process capability, or equipment reliability.
If the failure returns, the original causal hypothesis or corrective action should be reconsidered.
3. Five Whys Analysis
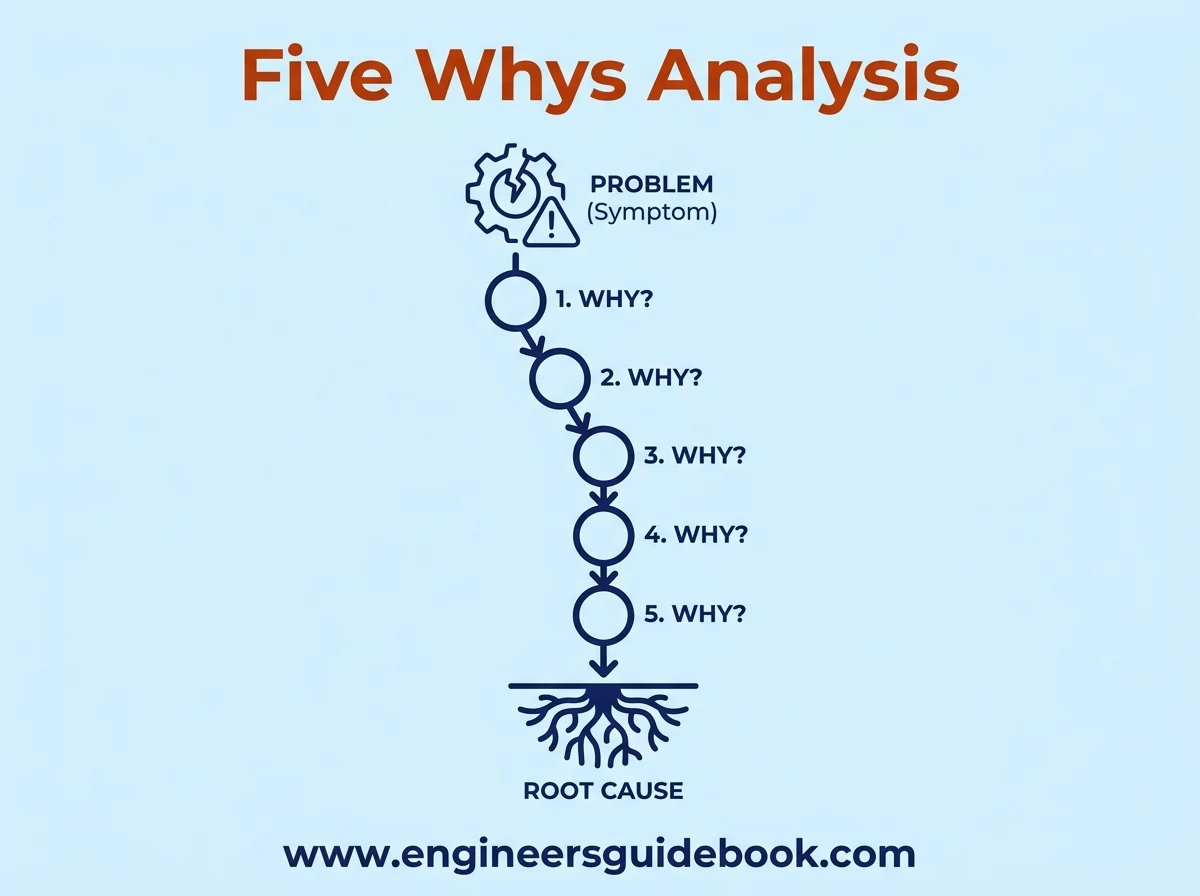
Five Whys is one of the simplest root cause analysis methods. It investigates a problem by repeatedly asking why an event occurred until the causal pathway reaches a deeper systemic issue.
Despite its simplicity, the method can be powerful when used with evidence.
3.1 Five Whys Principle
The principle is based on progressive causal interrogation.
Each answer becomes the subject of the next “why” question. The number five is not mandatory. Some investigations may reach a credible root cause after three questions, while others require seven or more.
The objective is causal depth, not numerical compliance.
3.2 Five Whys Procedure
Begin with a clearly defined event.
Ask why the event occurred and record the answer. Then ask why that condition existed. Continue until the investigation reaches a cause that can be controlled through a meaningful corrective action.
Each answer should be fact-based whenever possible.
If several explanations exist at one level, multiple causal branches may need investigation.
3.3 Five Whys Example
Consider a conveyor that suddenly stops during production.
Why did the conveyor stop? The motor overloaded.
Why did the motor overload? The conveyor belt required excessive torque.
Why was excessive torque required? A roller had seized.
Why did the roller seize? Its bearing failed.
Why did the bearing fail? Lubrication had not been performed because the lubrication point was omitted from the preventive maintenance checklist.
The immediate failure was the bearing. The systemic cause was a deficient maintenance control.
3.4 Five Whys Advantages
Five Whys requires little training, software, or statistical expertise.
It is fast, inexpensive, easy to communicate, and effective for straightforward cause-and-effect problems. It also encourages teams to move beyond superficial explanations such as “operator error” or “equipment failure.”
The technique is particularly suitable for frontline problem-solving.
3.5 Five Whys Limitations
The method becomes less reliable when failures have multiple interacting causes.
Different teams may also reach different conclusions because the questioning path depends heavily on investigator judgment. Another weakness is stopping too early at a convenient explanation.
Without supporting evidence, Five Whys can deteriorate into speculation.
3.6 Five Whys Best Uses
Five Whys works best for relatively simple, recurring operational problems where the causal sequence is reasonably linear.
Common examples include maintenance omissions, procedural failures, minor quality defects, repetitive stoppages, and administrative process errors.
Complex safety incidents or multi-system failures usually require a more rigorous technique.
4. Fishbone Diagram
Fishbone Diagram: How to Create an Ishikawa Diagram
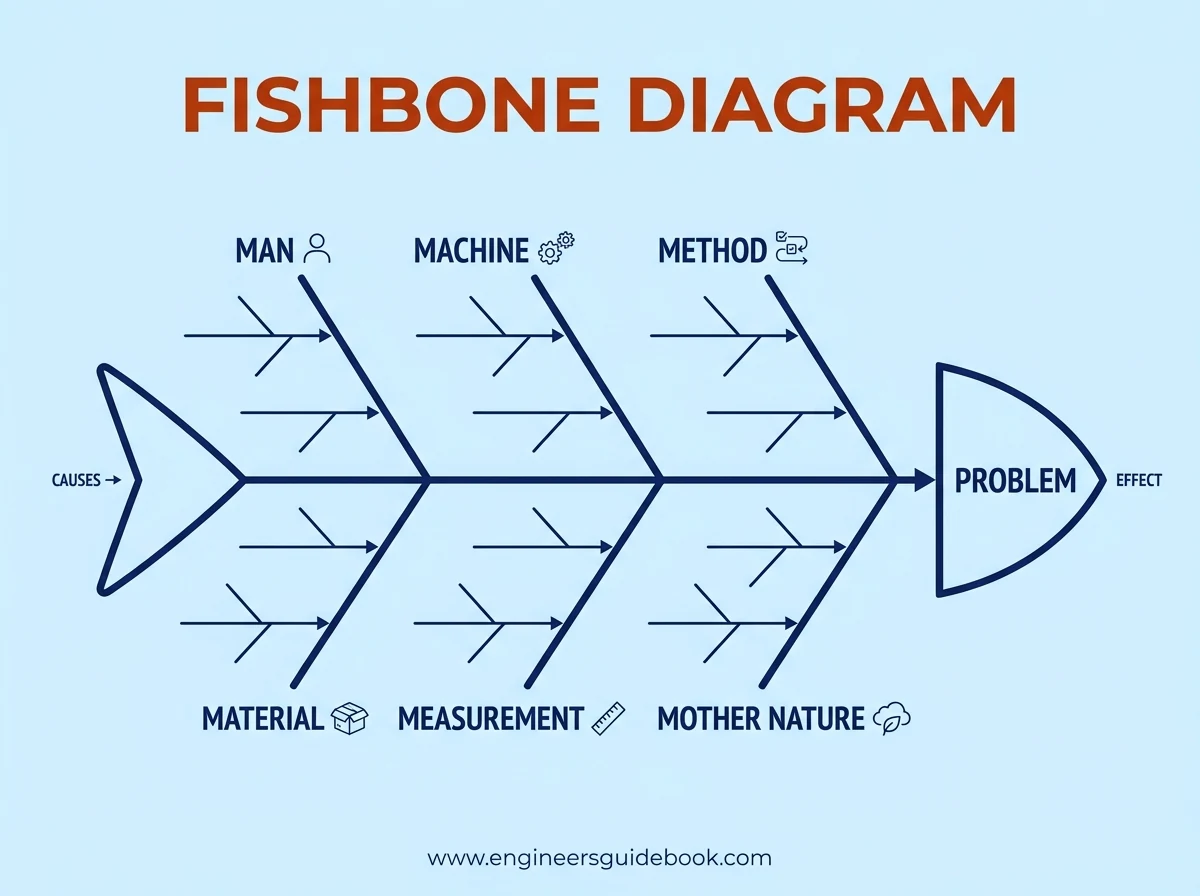
The Fishbone Diagram, also known as an Ishikawa Diagram or Cause-and-Effect Diagram, organizes possible causes into structured categories.
It is especially useful when a problem may result from many contributing factors.
4.1 Fishbone Diagram Structure
The diagram resembles a fish skeleton.
The problem statement appears at the head, while major causal categories form the main branches. Specific possible causes are then added as smaller branches beneath each category.
This visual structure helps teams explore the problem comprehensively rather than concentrating on the first plausible explanation.
4.2 Six M Categories
Manufacturing investigations frequently use six traditional categories known as the Six Ms:
Man, Machine, Method, Material, Measurement, and Mother Nature.
Man covers human factors. Machine addresses equipment. Method examines procedures and operating practices. Material covers raw materials and consumables. Measurement considers instruments and data accuracy. Mother Nature addresses environmental conditions.
Other industries may adapt these categories.
4.3 Fishbone Analysis Steps
Start with a precise problem statement and assemble a knowledgeable cross-functional team.
Create the major causal categories and brainstorm possible contributors within each one. After generating the candidate causes, prioritize those with credible evidence and investigate them further.
The diagram generates hypotheses. It does not prove them.
4.4 Fishbone Diagram Example
Suppose a filling line produces inconsistent container weights.
Machine-related causes might include nozzle wear or pressure instability. Method-related causes could involve incorrect setup. Material factors might include viscosity variation. Measurement factors could include an improperly calibrated weighing scale.
By displaying these possibilities together, the investigation becomes broader and less susceptible to tunnel vision.
4.5 Fishbone Advantages
Fishbone analysis promotes structured brainstorming and cross-functional participation.
It is visually intuitive and helps prevent important causal categories from being ignored. The method is particularly valuable early in an investigation when the actual root cause is uncertain.
It also provides a useful record of the team’s reasoning.
4.6 Fishbone Limitations
A Fishbone Diagram can become crowded when dozens of possible causes are listed.
More importantly, every item on the diagram is initially only a hypothesis. The technique does not quantify causal strength or demonstrate that one factor caused the event.
Verification must follow.
5. Fault Tree Analysis
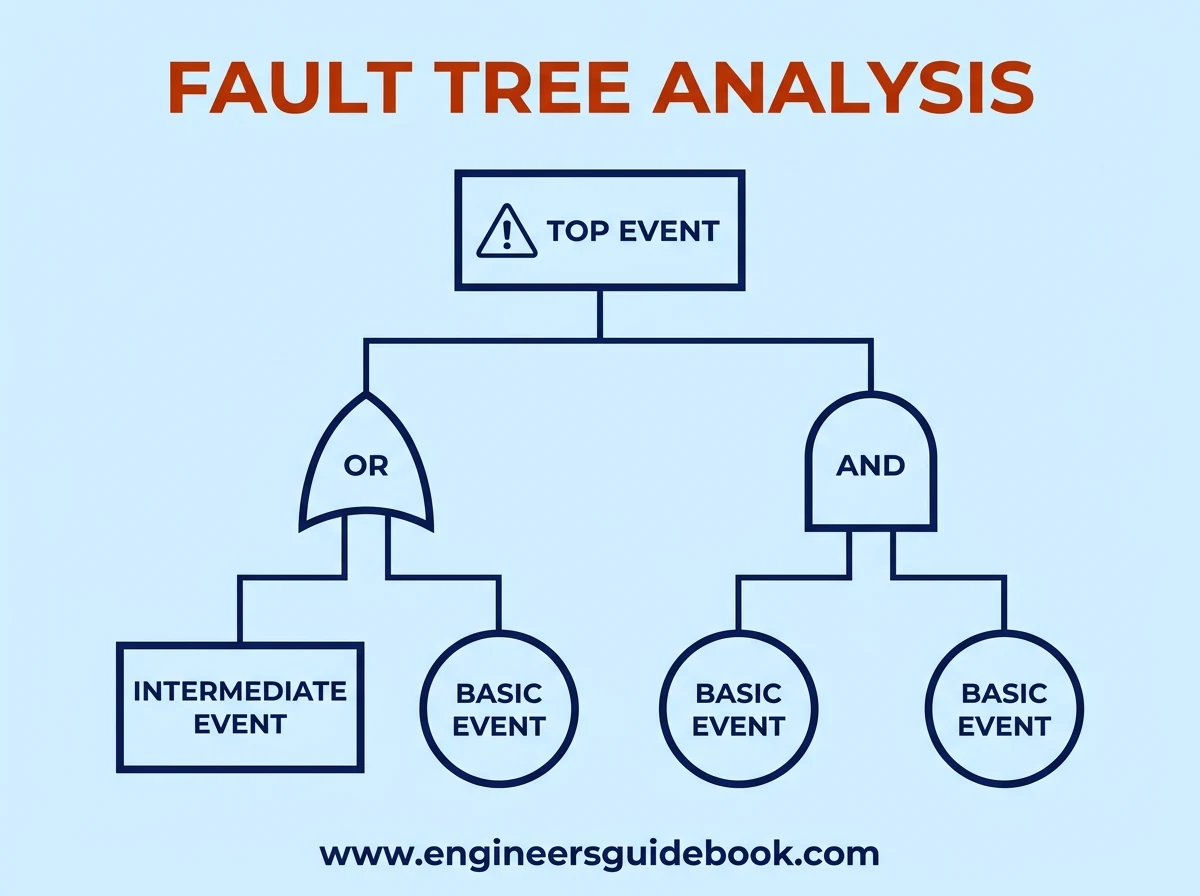
Fault Tree Analysis uses deductive logic to determine how combinations of lower-level failures can produce a defined undesirable event.
It is more formal than Five Whys or Fishbone Analysis and is frequently used in reliability and safety engineering.
5.1 Fault Tree Structure
A fault tree begins with a top event , such as loss of cooling or system shutdown.
The event is decomposed downward into intermediate events and basic causes. The resulting tree shows the logical pathways capable of producing the top event.
This hierarchical structure makes complex failure mechanisms easier to examine.
5.2 Logic Gates
FTA commonly uses AND and OR gates.
An OR gate indicates that any one of several causes can produce the event. An AND gate indicates that multiple conditions must occur together.
These logical relationships distinguish Fault Tree Analysis from simpler brainstorming techniques.
5.3 Fault Tree Procedure
Define the top event precisely.
Identify the immediate conditions capable of producing it, connect those conditions using logical gates, and continue decomposition until basic events are reached.
Investigators can then evaluate the most significant failure pathways and identify suitable preventive controls.
5.4 Fault Tree Example
Consider loss of lubrication to a critical gearbox.
The top event could result from pump failure OR an empty lubricant reservoir OR blockage in the supply line. Pump failure might itself result from motor failure OR mechanical seizure.
The fault tree exposes several independent routes to the same operational consequence.
5.5 Fault Tree Advantages
FTA handles complex systems and multiple failure combinations exceptionally well.
It provides a clear logical representation of failure pathways and can support qualitative or quantitative risk assessment when probability data are available.
It is particularly valuable for safety-critical systems.
5.6 Fault Tree Limitations
Developing a detailed fault tree can be time-consuming.
The method also depends on strong system knowledge. Poorly defined logic or omitted failure modes can generate misleading conclusions.
For simple operational problems, FTA may be unnecessarily elaborate.
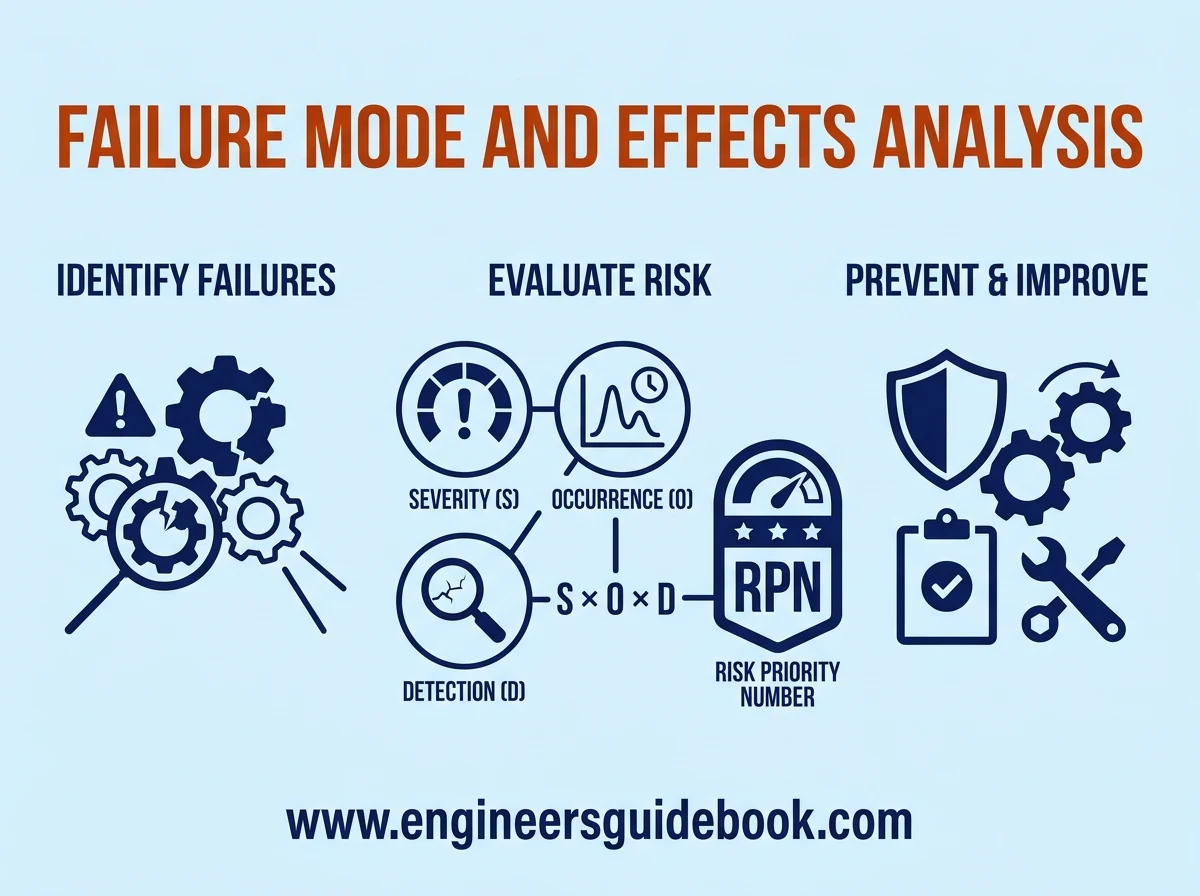
6. Failure Mode and Effects Analysis
Failure Mode and Effects Analysis is a proactive risk-analysis technique that evaluates how components, processes, or systems might fail and what consequences those failures could produce.
Unlike conventional RCA, FMEA is often performed before failure occurs.
6.1 FMEA Fundamentals
FMEA breaks a system into individual functions or process steps.
For each item, the team identifies potential failure modes, their effects, possible causes, existing controls, and relative risk.
This creates a structured inventory of vulnerabilities.
6.2 Failure Modes
A failure mode describes the specific manner in which something can fail.
Examples include leakage, fracture, blockage, overheating, incorrect assembly, loss of pressure, electrical short circuit, or inaccurate measurement.
Failure modes should be specific enough to support meaningful risk evaluation.
6.3 Severity Ratings
Severity represents the seriousness of the failure’s consequence.
Higher ratings are assigned to failures with major safety, environmental, quality, production, or customer impact.
Severity normally evaluates the effect, not how frequently the failure occurs.
6.4 Occurrence Ratings
Occurrence represents the likelihood or frequency of a particular cause or failure mode.
Historical maintenance records, defect data, field experience, and reliability information can support the rating.
Frequent failures receive higher occurrence scores.
6.5 Detection Ratings
Detection evaluates the ability of existing controls to identify the failure before the consequence reaches the user, process, or equipment.
Failures that are difficult to detect generally receive higher risk ratings.
Strong automatic detection systems can substantially lower exposure.
6.6 Risk Priority Number
Traditional FMEA commonly calculates a Risk Priority Number using:
RPN = Severity × Occurrence × Detection
A higher RPN indicates a greater need for review, although modern FMEA approaches should not rely on RPN alone.
High-severity risks may require action regardless of the numerical total.
6.7 FMEA Advantages
FMEA encourages proactive thinking.
It helps organizations prioritize limited resources, document risk knowledge, improve designs, strengthen preventive maintenance, and identify weak controls before failures become costly.
It is particularly valuable during equipment design and process development.
6.8 FMEA Limitations
Rating scales can be subjective.
Different teams may assign different scores to identical risks, and similar RPN values can conceal very different severity profiles.
FMEA also requires disciplined updating as processes and equipment change.
7. Pareto Analysis
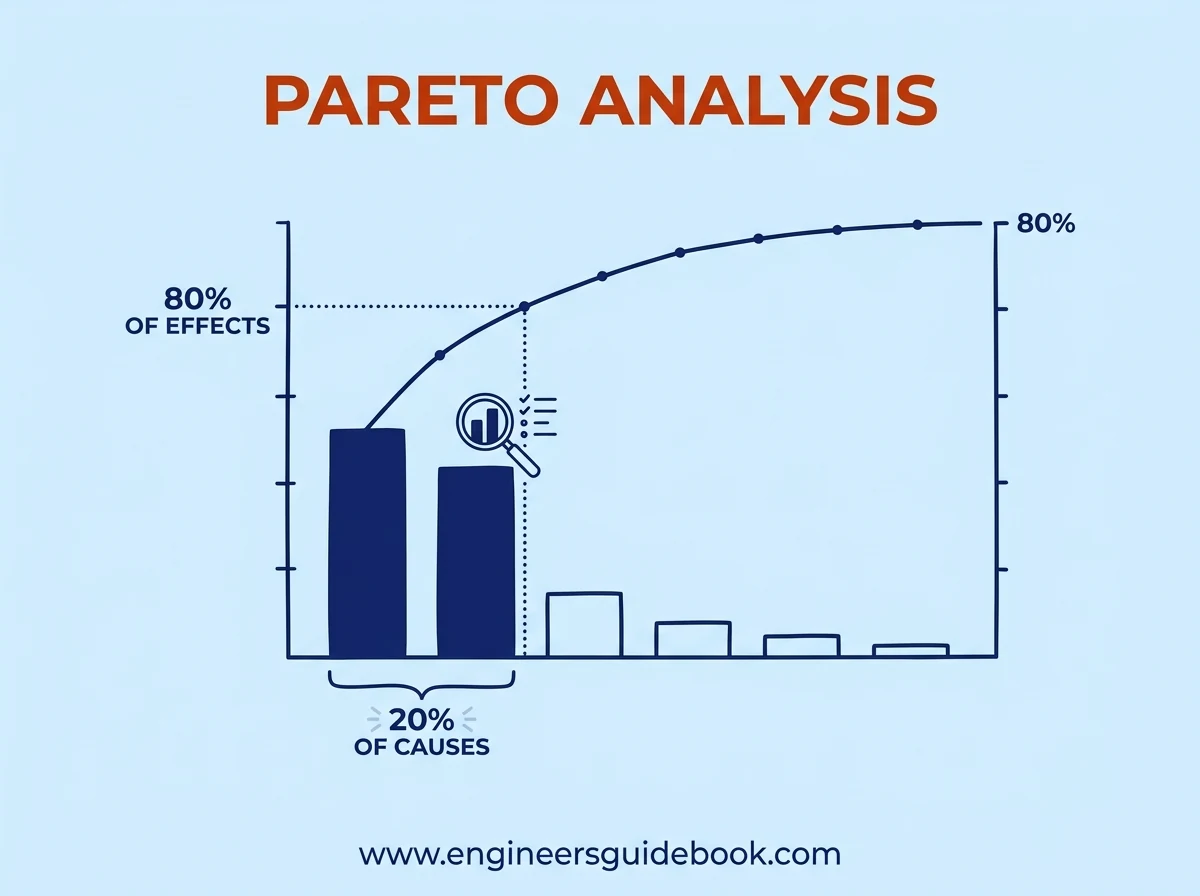
Pareto Analysis helps teams prioritize problems according to their relative frequency, cost, or impact.
Instead of treating every issue equally, the method concentrates attention on the categories responsible for the largest proportion of losses.
7.1 Pareto Principle
The Pareto Principle is commonly summarized as the 80/20 rule.
In practical problem-solving, a relatively small number of causes often account for a disproportionately large share of failures, downtime, complaints, or defects.
The exact ratio does not need to be 80/20.
7.2 Pareto Chart
A Pareto chart displays categories as descending bars, usually accompanied by a cumulative percentage line.
Categories may represent failure modes, equipment groups, defect types, downtime causes, customer complaints, or maintenance expenditures.
The arrangement makes dominant contributors immediately visible.
7.3 Pareto Analysis Steps
Collect reliable data for a defined period and classify the events into meaningful categories.
Calculate the frequency, cost, downtime, or another relevant metric for each category. Sort the categories from highest to lowest and calculate the cumulative contribution.
The leading categories become priority candidates for deeper RCA.
7.4 Pareto Analysis Example
Suppose a production line records 200 downtime events.
If 120 events are associated with only three causes—sensor faults, conveyor jams, and filling nozzle blockage—those categories deserve priority investigation.
A focused RCA on these dominant problems may create significantly greater value than investigating several isolated low-frequency failures.
7.5 Pareto Advantages
Pareto Analysis is simple, visual, and highly effective for prioritization.
It helps maintenance and quality teams allocate resources where improvement is likely to produce the greatest operational benefit.
It also works well with large historical datasets.
7.6 Pareto Limitations
Pareto Analysis identifies where problems are concentrated, but it does not explain why they occur.
The method can also produce distorted priorities if categories are poorly defined or the underlying data are inaccurate.
For this reason, Pareto Analysis is often best used as a screening technique before applying a deeper RCA method.
8. Barrier Analysis and Change Analysis
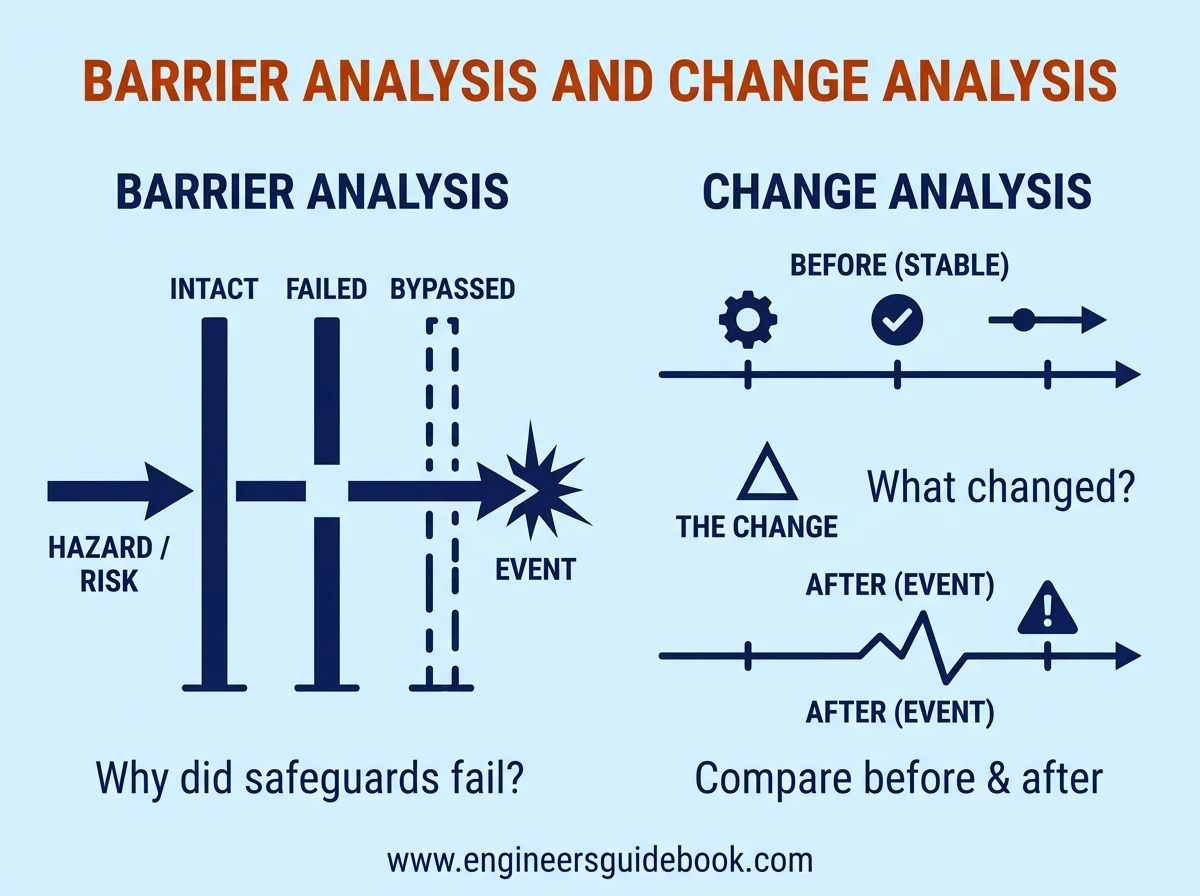
Barrier Analysis and Change Analysis examine problems from two complementary perspectives. One asks which protective controls failed or were missing. The other investigates what changed before the event occurred. Both methods are especially useful when an incident cannot be explained by a single equipment defect or human action.
8.1 Barrier Analysis
Barrier Analysis identifies the safeguards intended to prevent an undesirable event and determines why those safeguards did not work.
A barrier may stop a hazard from occurring, interrupt escalation, detect abnormal conditions, or reduce the consequences after failure. The method is therefore common in safety, reliability, process engineering, and incident investigation.
Its strength lies in shifting attention from individual error toward system defenses.
8.2 Barrier Types
Barriers can be physical, procedural, administrative, technological, or organizational.
Physical barriers include guards, relief valves, interlocks, containment systems, and emergency shutdown devices. Administrative barriers include permits, inspections, operating procedures, checklists, and training.
Some barriers are preventive, while others are mitigative. A pressure switch may prevent overpressure, whereas a relief valve may mitigate the consequences if pressure continues to rise.
8.3 Barrier Failure Identification
The investigation should determine whether a required barrier was absent, inadequate, bypassed, degraded, incorrectly designed, or simply ineffective.
For each safeguard, investigators should ask whether it existed, whether it was functional, whether personnel understood it, and whether conditions allowed it to perform as intended.
A failed barrier often reveals deeper organizational weaknesses such as poor maintenance, deficient design review, inadequate training, or weak management of change.
8.4 Change Analysis
Change Analysis investigates differences between a period when the system worked correctly and a period when the failure occurred.
The central question is straightforward: what changed?
Changes may involve equipment, materials, suppliers, operators, software, procedures, environment, workload, settings, maintenance practices, or process parameters.
Even subtle changes can be causally significant.
8.5 Change Comparison
A structured comparison typically examines before-and-after conditions.
Investigators may compare production rates, temperatures, pressures, maintenance records, staffing, component revisions, raw materials, software versions, or operating sequences.
The objective is to distinguish meaningful deviations from background variation.
Change comparison is particularly effective when a previously stable process suddenly begins producing defects or failures.
8.6 Barrier Analysis Applications
Barrier Analysis is widely used for safety incidents, chemical releases, machinery injuries, electrical events, fires, and equipment protection failures.
It can also support maintenance investigations. If a gearbox failed because lubrication was lost, investigators might examine oil-level alarms, inspection routines, lubrication procedures, and condition-monitoring systems as separate protective barriers.
The method is especially valuable when several controls should have prevented the final outcome.
8.7 Change Analysis Applications
Change Analysis works well for sudden failures following modifications.
Typical examples include increased defect rates after a new material supplier, repeated equipment trips after a control-system update, unusual vibration after maintenance, or declining product quality after a production-rate increase.
It is less useful when no stable baseline exists or when the problem developed gradually over a long period.
9. Event and Causal Factor Analysis
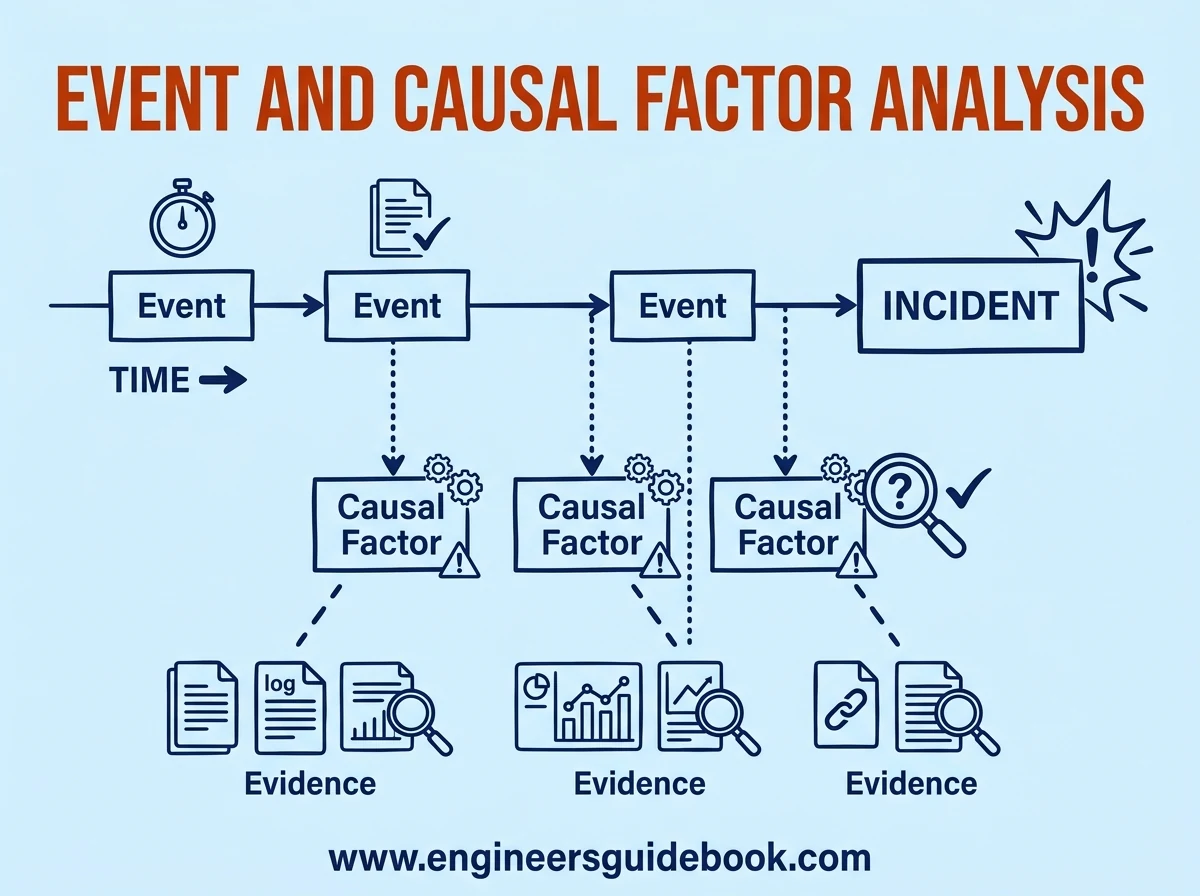
Event and Causal Factor Analysis reconstructs an incident chronologically and links significant events with the conditions that influenced them.
The technique is particularly useful for complicated incidents involving multiple people, decisions, equipment states, and time-dependent interactions.
9.1 Event Sequencing
Event sequencing places important actions and conditions in chronological order.
The sequence may begin hours, days, or even weeks before the actual failure if earlier decisions contributed to the outcome.
Events should be written objectively. Statements such as “operator opened valve” are preferable to judgmental phrases such as “operator incorrectly opened valve.”
9.2 Causal Factors
Causal factors are conditions or actions that materially influenced the event.
They may include equipment malfunction, missing information, procedural ambiguity, communication failure, abnormal operating conditions, design deficiencies, or organizational decisions.
Not every event on the timeline is causal.
A strong investigation separates background information from factors that actually altered the outcome.
9.3 Timeline Development
The timeline should integrate all available evidence.
Sources may include control-system logs, CCTV, maintenance records, interviews, shift reports, alarms, emails, inspection records, and production data.
When exact timing is uncertain, the uncertainty should be documented rather than concealed.
A reliable timeline frequently exposes contradictions that would remain hidden in narrative reports.
9.4 Evidence Mapping
Evidence Mapping links each event or causal factor to supporting documentation.
For example, an alarm activation may be supported by historian data, while a maintenance action may be verified through a work order.
This method improves traceability and reduces speculative conclusions.
It also helps investigators identify information gaps requiring additional evidence.
9.5 Causal Factor Verification
Each proposed causal factor should be challenged.
Investigators should ask whether the event would probably have occurred if that factor had been absent. They should also examine alternative explanations and contradictory evidence.
This counterfactual reasoning helps distinguish genuine causal factors from coincidental conditions.
Verification increases analytical rigor.
9.6 Event Analysis Applications
Event and Causal Factor Analysis is well suited to major accidents, process upsets, shutdowns, environmental incidents, complex equipment failures, and operational events involving several departments.
It is particularly useful when sequence matters.
For simple failures with a direct mechanism, the method may be unnecessarily elaborate.
10. Kepner Tregoe and Apollo RCA
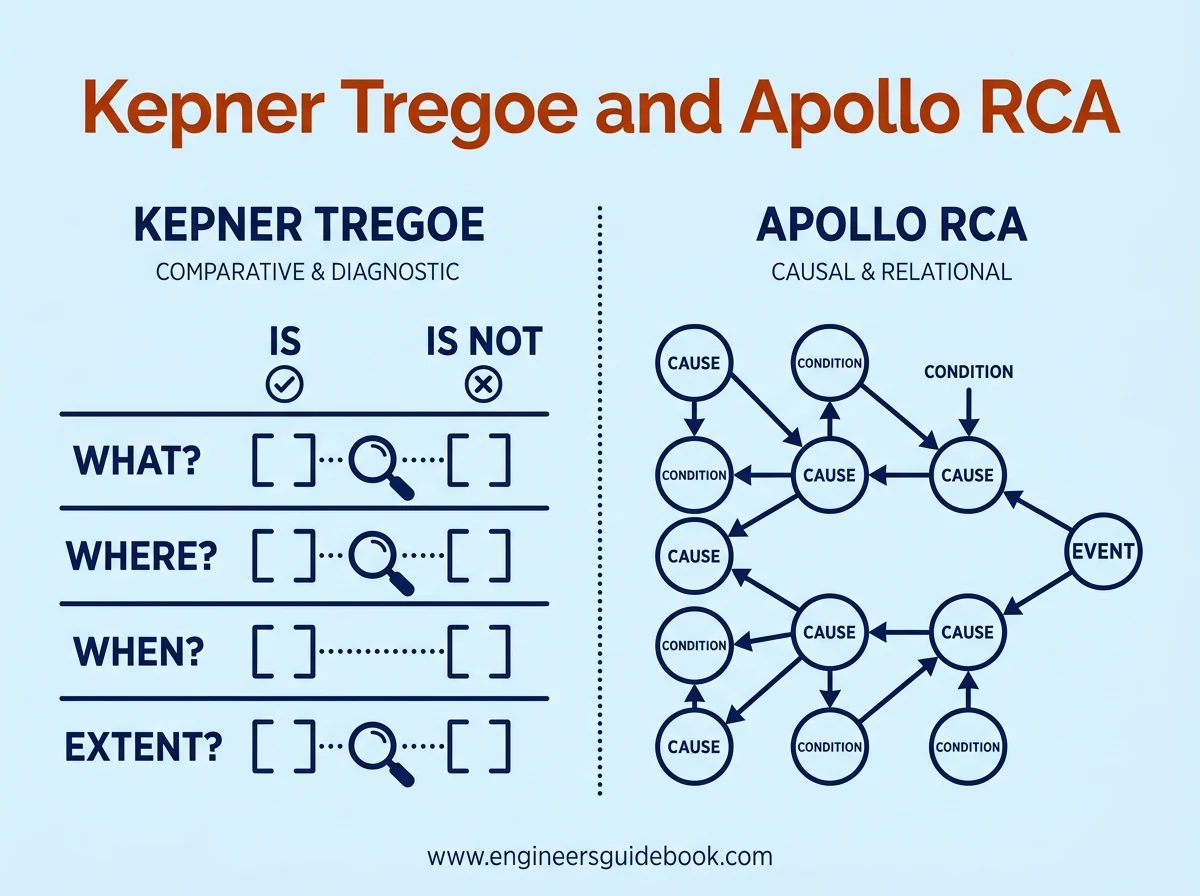
Kepner Tregoe and Apollo RCA are structured problem-solving methodologies designed to reduce speculation and improve causal reasoning.
Both encourage disciplined analysis, but they organize information differently.
10.1 Kepner Tregoe Analysis
Kepner Tregoe Analysis uses systematic comparison to define a problem and evaluate possible causes.
The methodology emphasizes distinctions such as what the problem is and what it is not , where it occurs, when it occurs, and the magnitude of the deviation.
This comparative structure helps investigators avoid vague descriptions.
10.2 Problem Specification
Problem Specification normally examines identity, location, timing, and extent.
Investigators may ask which machine is affected and which similar machine is not, where the defect appears and where it does not, when the problem started, and how large the deviation has become.
These contrasts frequently reveal clues that ordinary brainstorming misses.
10.3 Possible Cause Testing
Potential causes are tested against the complete problem specification.
A credible cause should explain both the observed conditions and the notable absences.
If a proposed cause explains why one machine failed but cannot explain why an identical adjacent machine did not, the hypothesis requires further scrutiny.
This approach strongly discourages premature conclusions.
10.4 Apollo RCA
Apollo RCA emphasizes cause-and-effect relationships rather than searching for one simplistic root cause.
The method recognizes that significant incidents usually result from multiple interacting causes and conditions.
It therefore develops a network of causal relationships leading toward the observed effect.
10.5 Cause and Effect Mapping
Cause-and-effect mapping begins with the undesirable event and works backward.
Investigators ask what conditions were necessary for each effect to occur. Each cause can then be expanded into additional causes until the map adequately explains the event.
Evidence should support every significant relationship.
The resulting map often resembles a branching causal network rather than a linear chain.
10.6 Solution Identification
Solutions should target controllable causes identified in the causal map.
A strong solution should prevent recurrence, reduce risk, remain practical, and avoid creating new hazards.
Several corrective actions may be necessary because complex failures rarely originate from one isolated condition.
Engineering controls are generally more robust than reminders or retraining alone.
10.7 Method Comparison
Kepner Tregoe excels when investigators need to distinguish between affected and unaffected conditions.
Apollo RCA is stronger when multiple interacting causes must be represented explicitly.
Kepner Tregoe is comparative and diagnostic. Apollo is causal and relational.
Both are more structured than informal brainstorming and can complement other RCA tools.
11. RCA Methods Comparison
No single root cause analysis technique is universally superior.
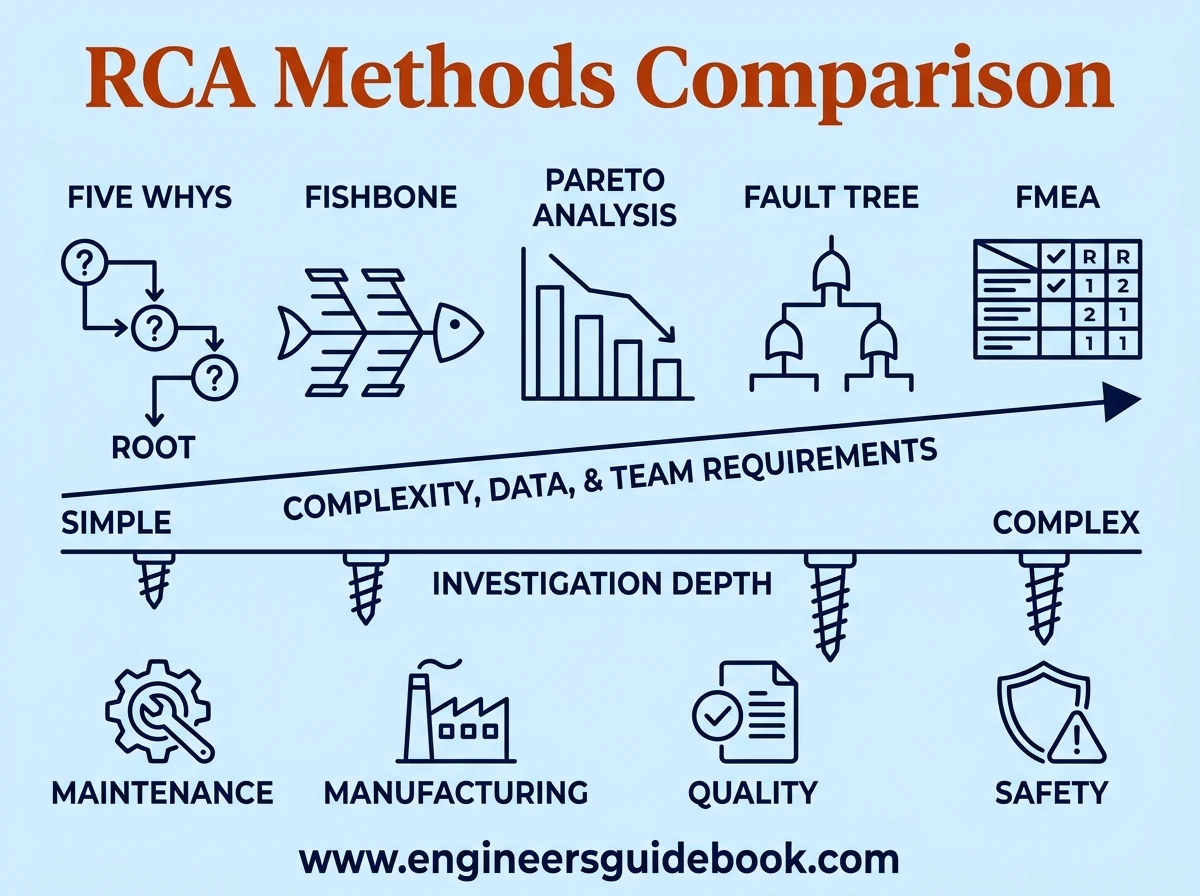
The appropriate method depends on problem complexity, available evidence, risk level, time, team capability, and the consequences of reaching the wrong conclusion.
11.1 Method Selection
Simple linear problems may be handled effectively with Five Whys.
Fishbone Analysis is useful when many possible categories exist. Pareto Analysis helps prioritize recurring issues. Fault Tree Analysis is stronger for logical failure combinations. FMEA is appropriate for prospective risk assessment.
Method selection should follow the problem, not organizational habit.
11.2 Complexity Comparison
Five Whys and Pareto Analysis are relatively simple.
Fishbone and Change Analysis require moderate structure. Event and Causal Factor Analysis, Fault Tree Analysis, Apollo RCA, and comprehensive FMEA studies demand more time and expertise.
Greater complexity should only be introduced when the risk and problem structure justify it.
11.3 Data Requirements
Some techniques can begin with limited qualitative information.
Others depend heavily on reliable historical or technical data. Pareto Analysis needs categorized datasets. FMEA benefits from failure history. Fault Tree Analysis may require component reliability information.
Poor data quality can undermine even the most sophisticated method.
11.4 Investigation Depth
Investigation depth should match consequence severity.
A brief Five Whys analysis may be sufficient for a minor repetitive stoppage. A serious injury, major equipment loss, or environmental event warrants much deeper causal analysis.
The purpose is not to maximize paperwork. It is to achieve sufficient causal confidence.
11.5 Team Requirements
Simple RCA can often be completed by a small operational team.
Complex investigations may require maintenance engineers, operators, process specialists, safety professionals, quality personnel, instrumentation experts, and management representatives.
Cross-functional participation reduces disciplinary blind spots.
11.6 Best Use Cases
Five Whys suits straightforward recurring problems. Fishbone works well for broad hypothesis generation. Pareto helps prioritize large problem populations. Change Analysis suits sudden deviations. Barrier Analysis is strong for control failures. Fault Tree Analysis fits safety-critical systems.
FMEA is best for anticipating failures before they occur.
11.7 Manufacturing Applications
Manufacturing teams use RCA for scrap, defects, downtime, process instability, equipment failures, yield loss, and production bottlenecks.
Combining Pareto Analysis with Fishbone or Five Whys is common because Pareto identifies the dominant problem while deeper RCA identifies its causes.
11.8 Maintenance Applications
Maintenance RCA commonly focuses on repetitive breakdowns, lubrication failures, premature bearing damage, seal leakage, overheating, vibration, and shortened component life.
Historical CMMS data, condition-monitoring trends, failed-part inspection, and maintenance records are especially valuable evidence sources.
11.9 Safety Applications
Safety investigations require greater methodological discipline because consequences can be severe.
Barrier Analysis, Event and Causal Factor Analysis, Fault Tree Analysis, and Apollo RCA are often more suitable than simplistic single-cause techniques.
Investigations should avoid defaulting to “human error” without examining system conditions.
11.10 Quality Applications
Quality teams apply RCA to customer complaints, nonconformities, process deviations, audit findings, and CAPA investigations.
Fishbone, Five Whys, Pareto Analysis, and FMEA are particularly common.
Corrective actions should be validated to ensure the defect does not quietly reappear.
12. Root Cause Analysis FAQs
12.1 What Are the Most Common Root Cause Analysis Methods
The most common methods include Five Whys, Fishbone Analysis, Pareto Analysis, Fault Tree Analysis, FMEA, Barrier Analysis, Change Analysis, Event and Causal Factor Analysis, Kepner Tregoe, and Apollo RCA.
Each serves a different analytical purpose.
12.2 Which Root Cause Analysis Method Is Best
There is no universally best RCA method.
Five Whys may be ideal for a simple maintenance problem, while Fault Tree Analysis may be better for a complex safety-critical system. The best method is the one that matches the complexity, risk, and evidence available.
12.3 What Is the Difference Between Five Whys and Fishbone Analysis
Five Whys follows a causal chain by repeatedly asking why.
Fishbone Analysis explores multiple categories of possible causes simultaneously. Five Whys is more linear, while Fishbone is broader and better suited to multifactor problems.
12.4 What Is the Difference Between RCA and FMEA
RCA usually investigates why a failure already occurred.
FMEA is primarily preventive and evaluates how a system could fail before the failure happens. Both can support reliability improvement, but they operate from different temporal perspectives.
12.5 How Do You Know When You Have Found the Root Cause
A credible root cause should be supported by evidence, explain the observed failure, and lead to an actionable corrective measure.
If removing or controlling the cause would reasonably prevent recurrence, the investigation is approaching causal closure.
12.6 Can a Problem Have More Than One Root Cause
Yes.
Complex failures often result from multiple technical, human, procedural, and organizational causes interacting together. Searching for one singular cause can oversimplify the system.
12.7 How Long Should a Root Cause Analysis Take
The duration depends on complexity and risk.
A minor recurring defect may take hours, while a major safety or equipment incident may require days or weeks of evidence gathering, technical testing, and multidisciplinary review.
12.8 What Tools Are Used for Root Cause Analysis
Common tools include Five Whys worksheets, Fishbone Diagrams, Pareto charts, fault trees, FMEA tables, timelines, causal maps, inspection data, statistical tools, CMMS records, and process historian data.
The analytical technique matters more than the software used to document it.
12.9 When Should Root Cause Analysis Be Performed
RCA should be considered when a problem is repetitive, costly, safety-critical, environmentally significant, operationally disruptive, or resistant to ordinary corrective maintenance.
It is also appropriate when regulations or quality systems require formal investigation.
12.10 How Can Root Cause Analysis Prevent Recurring Problems
RCA prevents recurrence by identifying and controlling the underlying conditions that created the failure.
Instead of repeatedly repairing symptoms, the organization modifies the system, process, design, or control structure that allowed the problem to develop.
13. Conclusion
Root cause analysis is most effective when treated as disciplined causal investigation rather than a documentation exercise.
The objective is simple: understand why the problem occurred well enough to stop it from happening again.
Simple failures may need Five Whys. Broad problems may need Fishbone Analysis. High-risk systems may require Fault Tree Analysis or Barrier Analysis. Large datasets may first require Pareto prioritization.
The method should reflect the nature of the problem.
Methodological fit matters more than methodological sophistication.