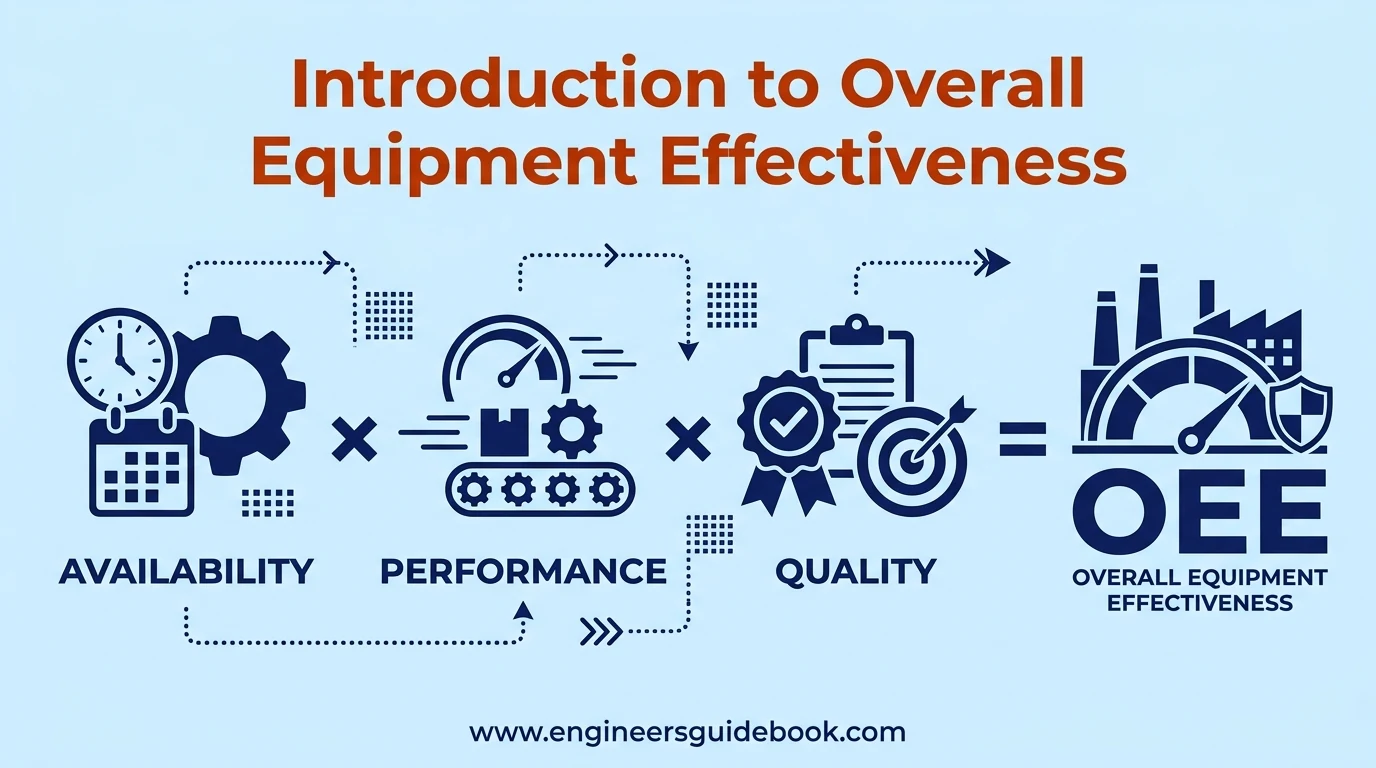
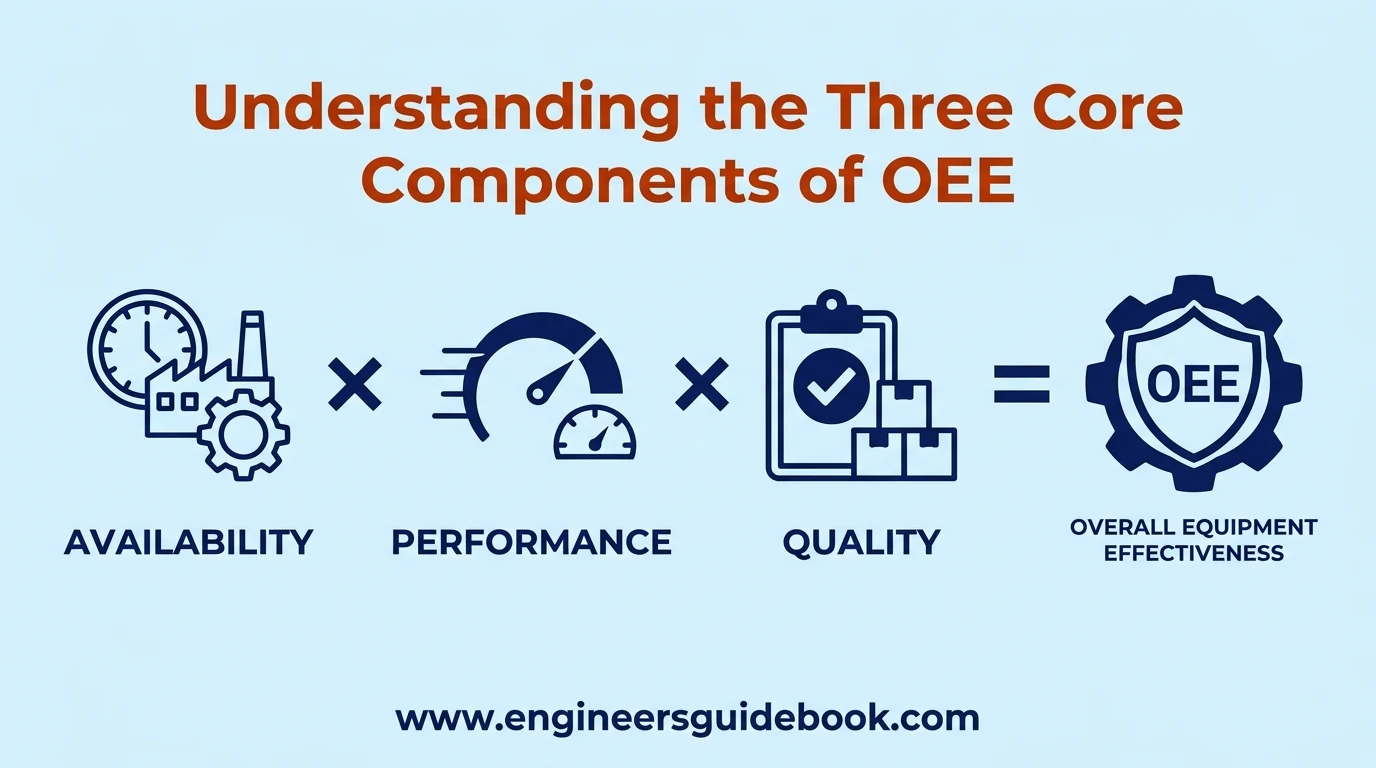
Overall Equipment Effectiveness (OEE) measures how efficiently manufacturing equipment converts planned production time into good-quality products. It is calculated using OEE = Availability × Performance × Quality. This manufacturing KPI helps identify downtime, speed losses, and production defects. A higher OEE indicates better equipment productivity, manufacturing reliability, and operational efficiency.
1. Introduction to Overall Equipment Effectiveness
1.1. What Is Overall Equipment Effectiveness (OEE)?
Overall Equipment Effectiveness (OEE) is a manufacturing performance indicator measuring productive equipment utilization during scheduled operations. It combines machinery availability, operating speed, and output quality into one percentage.
Widely associated with Total Productive Maintenance (TPM), OEE reveals hidden production losses that conventional output measurements often overlook.
1.2. Why OEE Matters in Manufacturing and Industrial Operations
Manufacturers face increasing pressure to maximize throughput while controlling maintenance expenditure, energy consumption, and manufacturing waste.
OEE provides a systematic framework for identifying operational inefficiencies and prioritizing improvement initiatives.
It enables production managers to distinguish mechanical reliability problems from process inefficiencies and quality-related losses.
1.3. How OEE Measures Manufacturing Productivity
OEE evaluates how much scheduled manufacturing time produces acceptable products at the equipment’s ideal operating speed.
It accounts for three fundamental productivity losses:
Availability losses caused by equipment stoppages.
Performance losses caused by reduced operating speed.
Quality losses caused by defective production.
Together, these measurements provide a comprehensive assessment of productive manufacturing capacity.
1.4. The Relationship Between OEE, Equipment Efficiency, and Production Performance
Equipment efficiency broadly describes productive resource utilization, whereas production performance measures actual manufacturing speed against an established ideal rate.
OEE extends beyond both concepts by incorporating equipment availability and product quality.
Consequently, machinery operating at maximum speed may still demonstrate poor OEE because of frequent breakdowns or excessive rejection rates.
1.5. Key Benefits of Tracking OEE in Manufacturing Plants
Implementing OEE monitoring offers several measurable advantages:
Reduced unplanned equipment downtime.
Improved production throughput.
Better preventive maintenance planning.
Lower manufacturing waste and rejection rates.
Improved equipment reliability and asset utilization.
Data-driven continuous improvement initiatives.
Regular monitoring also strengthens coordination between mechanical maintenance, production, and quality departments.
2. Understanding the Three Core Components of OEE
2.1. Availability and Its Impact on Equipment Utilization
Availability represents the percentage of planned production time during which equipment actually operates.
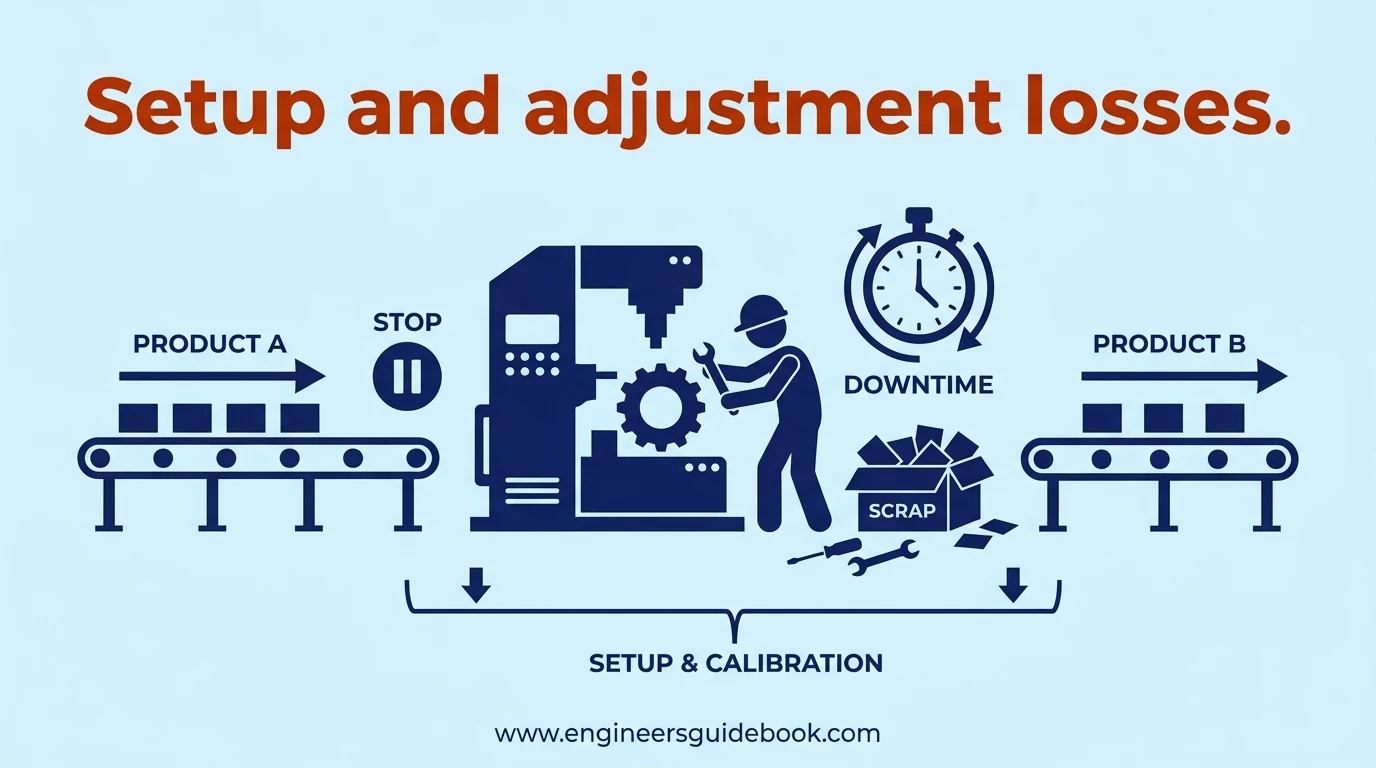
Breakdowns, changeovers, and equipment adjustments reduce availability.
For example, equipment operating for 420 minutes during 480 minutes of planned production achieves 87.5% availability .
This metric identifies time lost through operational interruptions.
2.2. Performance and Its Role in Production Efficiency
Performance evaluates actual production output against the theoretical output achievable during operating time.
Reduced machinery speed, micro-stoppages, and intermittent process disturbances decrease performance.
A filling machine producing 90 bottles per minute against an ideal rate of 100 bottles per minute achieves 90% performance , assuming a consistent operating period.
2.3. Quality and Its Contribution to First-Pass Yield
Quality measures the proportion of manufactured products meeting acceptance specifications without requiring rework.
Defective packaging, dimensional inaccuracies, contamination, and manufacturing inconsistencies reduce this component.
If 9,700 products satisfy quality standards from 10,000 manufactured units, the quality rate equals 97% .
2.4. How Availability, Performance, and Quality Work Together
The three OEE components interact multiplicatively rather than additively.
Consider the following manufacturing performance:
Component Percentage Availability 90% Performance 95% Quality 98% OEE 83.79%
Despite relatively strong individual indicators, cumulative production losses reduce overall effectiveness to 83.79%.
2.5. Understanding the Six Big Losses of Manufacturing
The Six Big Losses framework categorizes manufacturing inefficiencies into six principal groups:
1. Equipment failures and breakdowns.

2. Setup and adjustment losses.
3. Idling and minor stoppages.

4. Reduced operating speed.

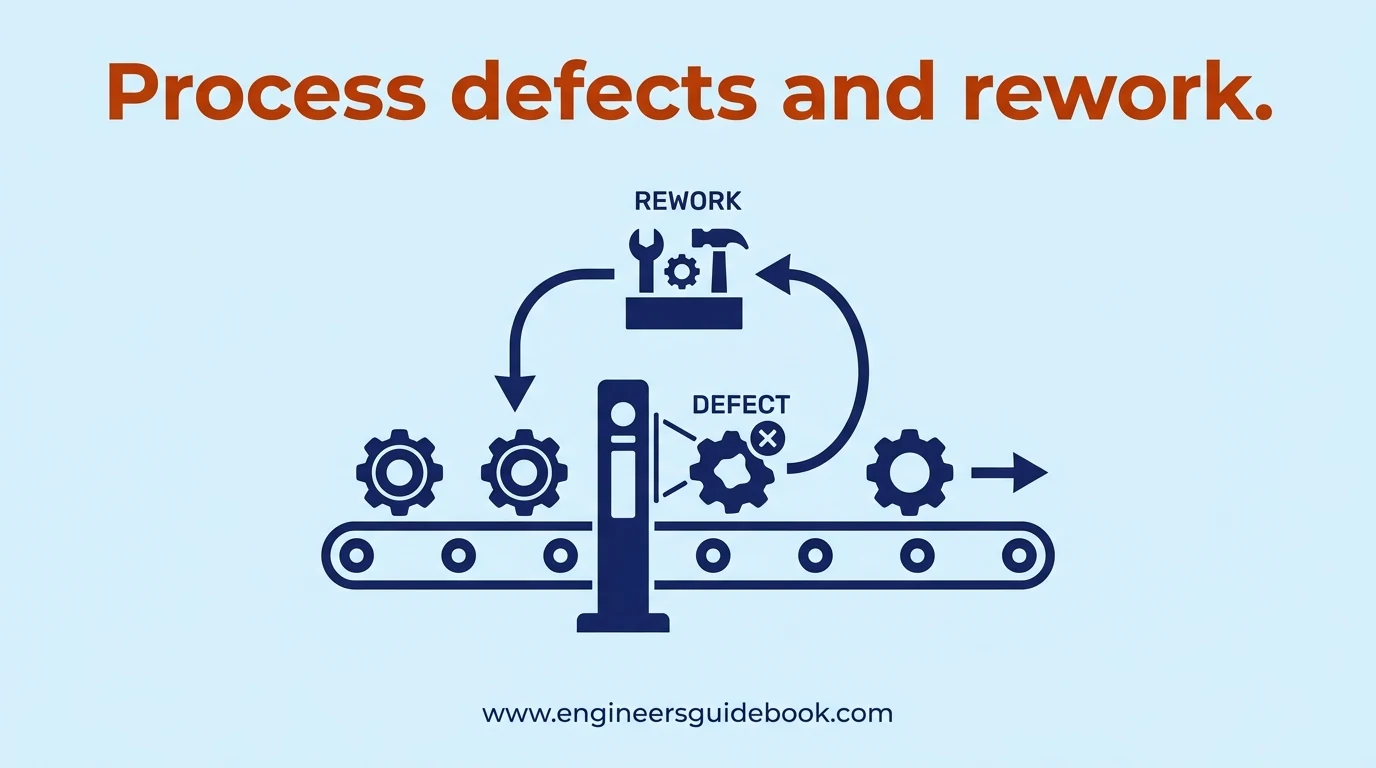
5. Process defects and rework.
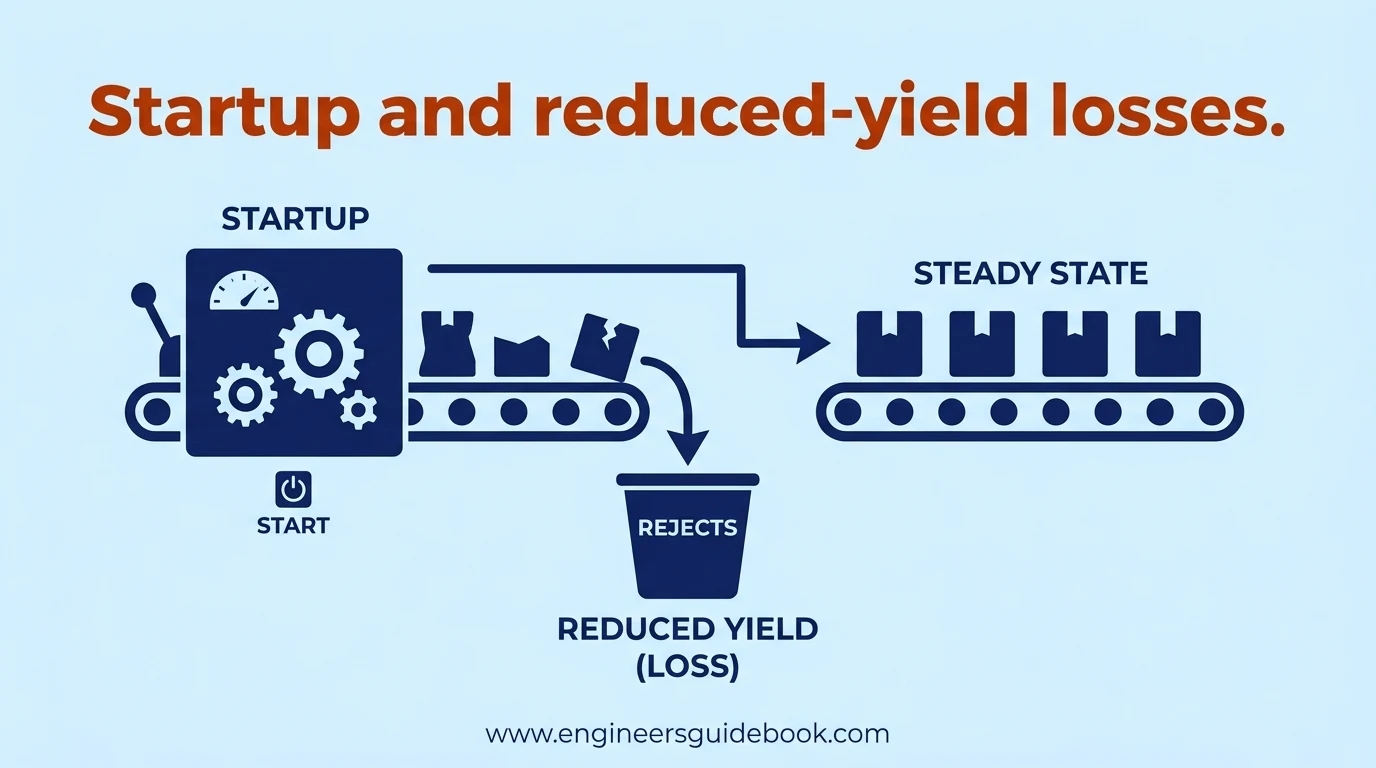
6. Startup and reduced-yield losses.
These categories form the foundation of systematic OEE loss analysis.
2.6. How the Six Big Losses Affect OEE Scores
Equipment breakdowns and changeovers primarily affect availability.
Minor stoppages and reduced operating speeds diminish performance, while manufacturing defects and startup rejects reduce quality.
Classifying losses enables engineers to identify dominant inefficiencies and develop targeted corrective actions instead of applying generalized improvement measures.
3. Overall Equipment Effectiveness Formula Explained
3.1. Standard OEE Formula
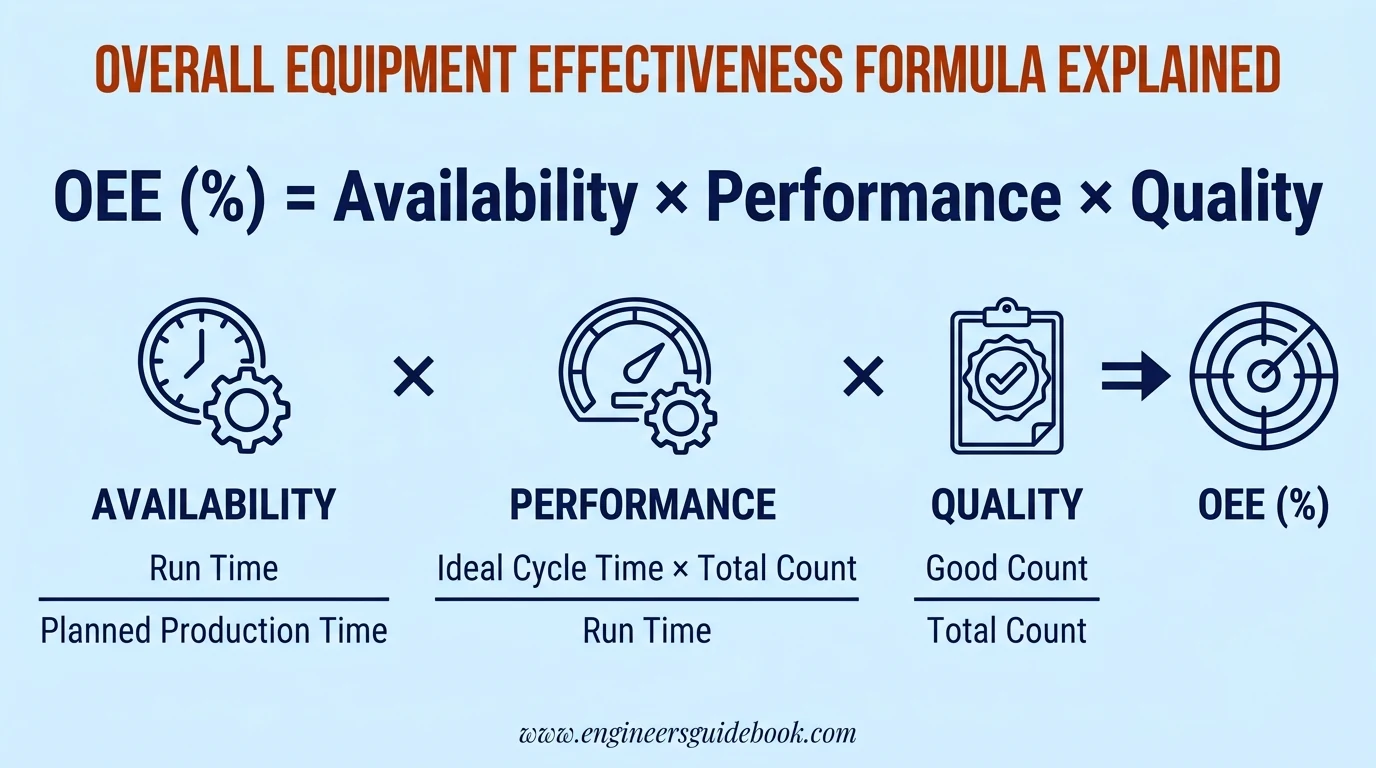
The standard OEE formula combines three manufacturing performance indicators:
OEE = Availability × Performance × Quality
When expressed as decimal fractions:
OEE (%) = Availability × Performance × Quality × 100
The resulting percentage indicates the proportion of scheduled manufacturing time effectively converted into acceptable production at ideal speed.
3.2. Availability Formula
Availability compares actual equipment operating time against planned production time.
Availability (%) = (Run Time / Planned Production Time) × 100
Run Time = Planned Production Time − Availability Downtime
Accurate downtime classification is essential for reliable calculations.
3.3. Performance Formula
Performance measures production speed relative to the validated ideal cycle time.
Performance (%) = (Ideal Cycle Time × Total Count / Run Time) × 100
Ideal cycle time represents the minimum sustainable manufacturing time per unit under defined operating conditions.
Both acceptable and defective units contribute to total count.
3.4. Quality Formula
Quality measures defect-free manufacturing output relative to total production.
Quality (%) = (Good Count / Total Count) × 100
Good Count excludes rejected products and units requiring rework.
Consistent quality acceptance criteria are necessary when comparing production shifts or manufacturing lines.
3.5. Alternative OEE Formula Using Good Count and Ideal Cycle Time
OEE can also be calculated directly using acceptable production output.
OEE (%) = (Good Count × Ideal Cycle Time / Planned Production Time) × 100
This equivalent equation is particularly useful for automated OEE calculators, spreadsheets, and manufacturing dashboards.
3.6. Understanding Planned Production Time, Run Time, and Net Run Time
Planned Production Time represents the scheduled duration during which manufacturing is intended.
Run Time is the remaining duration after subtracting availability-related stoppages.
Net Run Time is the theoretical duration required to manufacture total output at ideal cycle speed.
Net Run Time = Ideal Cycle Time × Total Count
Distinguishing these time categories prevents erroneous efficiency calculations.
3.7. How to Calculate OEE as a Percentage
Suppose manufacturing equipment achieves:
- Availability = 90%
- Performance = 90%
- Quality = 95%
The calculation becomes:
OEE (%) = 0.90 × 0.90 × 0.95 × 100
OEE = 0.7695 × 100
OEE = 76.95%
Therefore, 76.95% of planned production time represents fully effective manufacturing.
3.8. Common Mistakes When Applying OEE Formulas
Frequent mistakes include inconsistent downtime definitions, unrealistic ideal cycle times, and mixing percentage values with decimals.
Other problems include excluding defective units from total production counts and incorrectly treating scheduled breaks as production losses.
Standardized measurement procedures are essential for trustworthy performance reporting.
4. How to Calculate OEE Step by Step
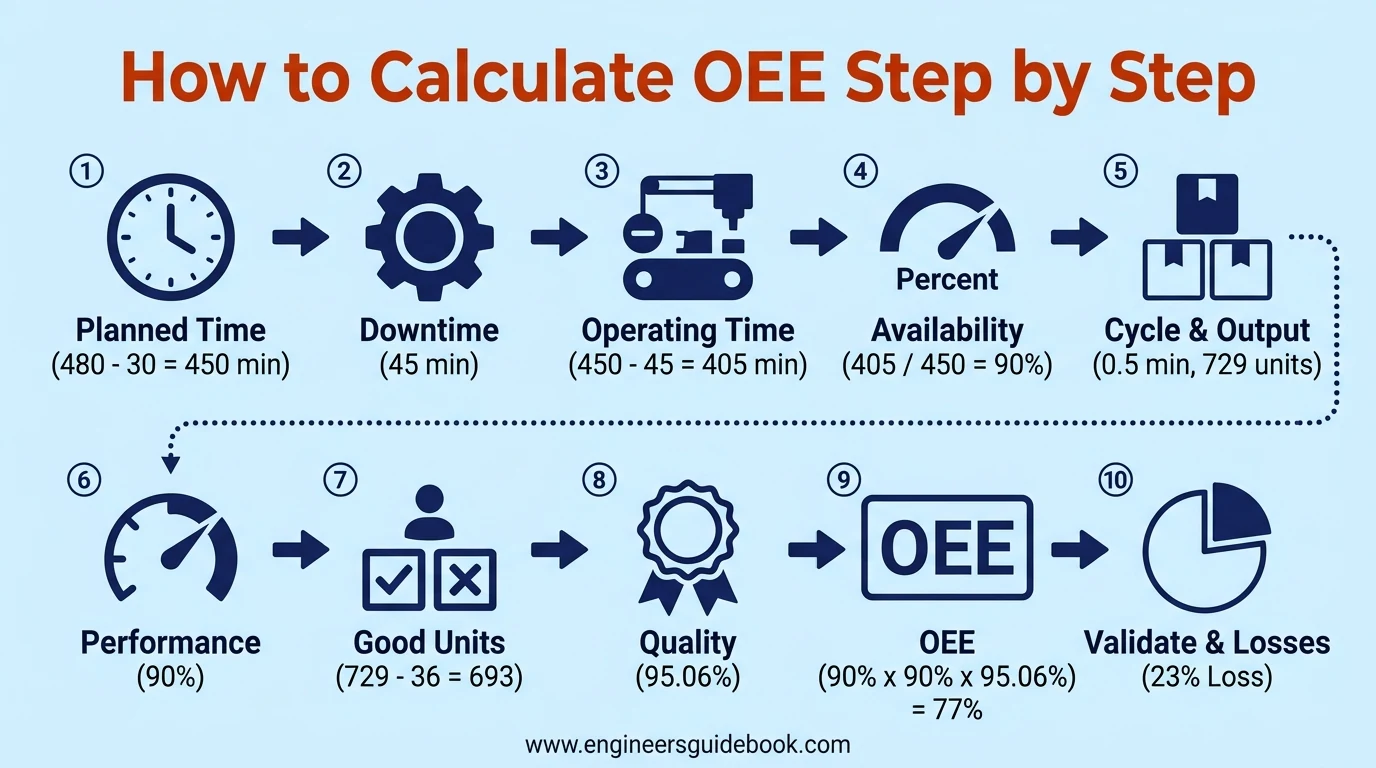
4.1. Step 1 – Determine Planned Production Time
Consider an eight-hour manufacturing shift containing a 30-minute scheduled meal break excluded from planned production.
Planned Production Time = Total Shift Time − Scheduled Break Time
Planned Production Time = 480 − 30 = 450 minutes
4.2. Step 2 – Calculate Equipment Downtime
Identify all availability-related stoppages during planned production.
Assume equipment breakdowns, changeovers, and adjustments collectively account for 45 minutes of downtime.
Total Equipment Downtime = 45 minutes
4.3. Step 3 – Determine Actual Operating Time
Subtract equipment downtime from planned production time.
Run Time = Planned Production Time − Equipment Downtime
Run Time = 450 − 45 = 405 minutes
The machine operated for 405 minutes.
4.4. Step 4 – Calculate Equipment Availability
Calculate availability using actual operating time.
Availability (%) = (Run Time / Planned Production Time) × 100
Availability (%) = (405 / 450) × 100
Availability = 90%
4.5. Step 5 – Identify Ideal Cycle Time and Total Production Count
Assume the equipment’s ideal cycle time is 0.5 minutes per unit.
During the operating period, the equipment manufactures 729 units, including rejected products.
Ideal Cycle Time = 0.5 minutes per unit
Total Production Count = 729 units
4.6. Step 6 – Calculate Production Performance
Apply the performance equation:
Performance (%) = (Ideal Cycle Time × Total Count / Run Time) × 100
Performance (%) = (0.5 × 729 / 405) × 100
Performance = 90%
4.7. Step 7 – Identify Good Products and Defective Units
Suppose quality inspection identifies 36 defective units.
Good Count = Total Production Count − Defective Units
Good Count = 729 − 36 = 693 units
Only first-pass acceptable units contribute to Good Count.
4.8. Step 8 – Calculate Quality Rate
Calculate acceptable production as a proportion of total output.
Quality (%) = (Good Count / Total Count) × 100
Quality (%) = (693 / 729) × 100
Quality ≈ 95.06%
4.9. Step 9 – Calculate Final OEE Percentage
Multiply availability, performance, and quality using unrounded values.
OEE (%) = Availability × Performance × Quality × 100
OEE (%) = 0.90 × 0.90 × (693 / 729) × 100
OEE = 77%
4.10. Step 10 – Validate Results and Identify Major Efficiency Losses
Verify the result using the alternative formula:
OEE (%) = (Good Count × Ideal Cycle Time / Planned Production Time) × 100
OEE (%) = (693 × 0.5 / 450) × 100
OEE = 77%
Both methods confirm identical effectiveness.
The remaining 23% represents combined availability, performance, and quality losses requiring further investigation.
5. OEE Calculation Examples for Manufacturing Equipment
5.1. Example 1 – Basic OEE Calculation for a Production Machine
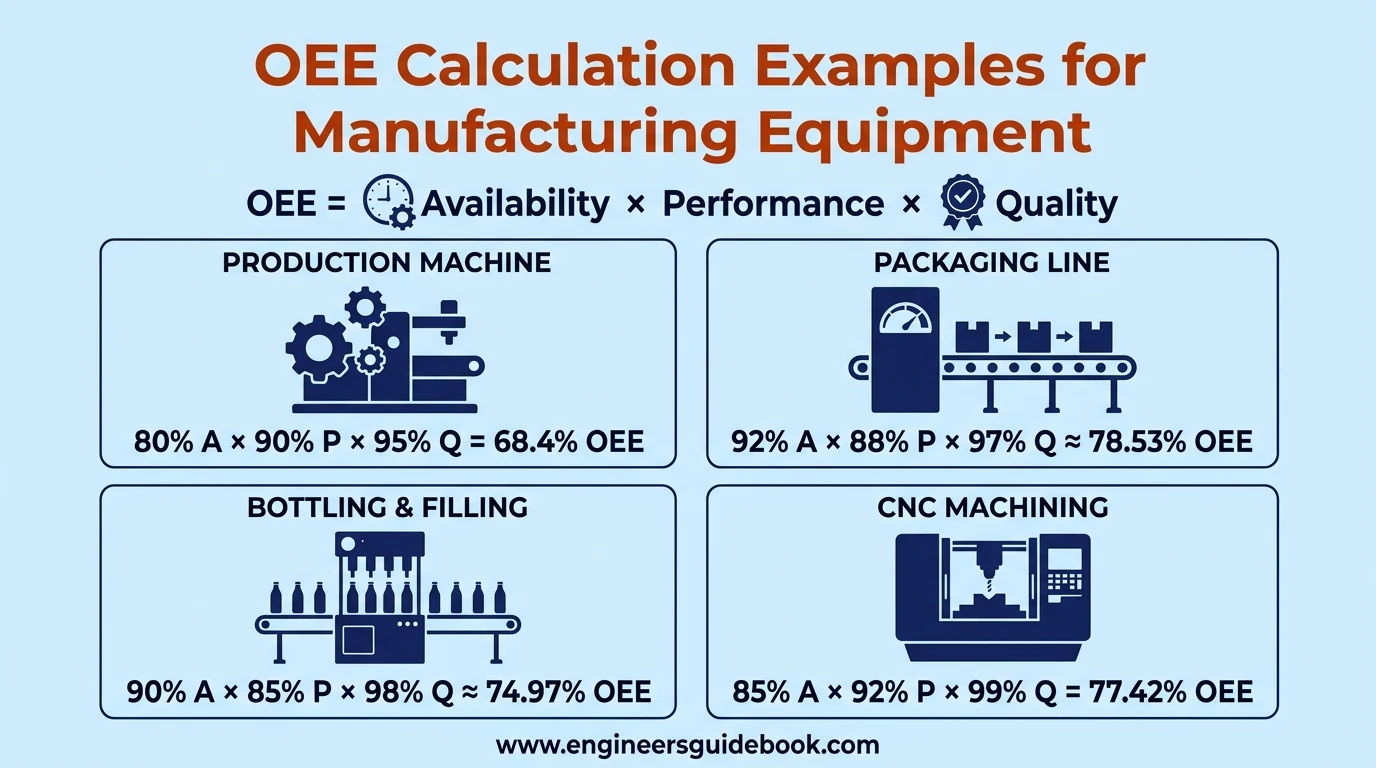
Consider a manufacturing machine with 80% availability, 90% performance, and 95% quality.
OEE (%) = Availability × Performance × Quality × 100
OEE (%) = 0.80 × 0.90 × 0.95 × 100
OEE = 68.4%
Availability represents the largest individual proportional loss, suggesting equipment stoppages deserve particular attention.
5.2. Example 2 – OEE Calculation for an Eight-Hour Manufacturing Shift
Consider an eight-hour manufacturing shift with the following operating conditions:
- Total Shift Time = 480 minutes
- Planned Production Time = 480 minutes
- Run Time = 420 minutes
- Ideal Cycle Time = 0.5 minutes per unit
- Total Production Count = 756 units
- Good Count = 720 units
Step 1: Calculate Availability
Availability (%) = (Run Time / Planned Production Time) × 100
Availability (%) = (420 / 480) × 100
Availability = 87.5%
Step 2: Calculate Performance
Performance (%) = (Ideal Cycle Time × Total Count / Run Time) × 100
Performance (%) = (0.5 × 756 / 420) × 100
Performance = 90%
Step 3: Calculate Quality
Quality (%) = (Good Count / Total Count) × 100
Quality (%) = (720 / 756) × 100
Quality ≈ 95.24%
Step 4: Calculate Overall Equipment Effectiveness
OEE (%) = Availability × Performance × Quality × 100
OEE (%) = 0.875 × 0.90 × (720 / 756) × 100
OEE = 75%
Therefore, 75% of the planned production time was utilized effectively to manufacture acceptable products at ideal operating speed.
5.3. Example 3 – OEE Calculation for a Packaging Production Line
A packaging line records 92% availability, 88% performance, and 97% quality.
OEE (%) = Availability × Performance × Quality × 100
OEE (%) = 0.92 × 0.88 × 0.97 × 100
OEE = 78.53%
Recurring conveyor interruptions, sensor faults, and reduced packaging speeds may explain performance deterioration.
5.4. Example 4 – OEE Calculation for a Bottling and Filling Machine
A liquid filling machine achieves 90% availability, 85% performance, and 98% quality.
OEE (%) = Availability × Performance × Quality × 100
OEE (%) = 0.90 × 0.85 × 0.98 × 100
OEE = 74.97%
Potential losses include nozzle dripping, filling-volume inconsistency, bottle misalignment, and intermittent capping-machine stoppages.
5.5. Example 5 – OEE Calculation for a CNC Machining Center
A CNC machining center records 85% availability, 92% performance, and 99% quality.
OEE (%) = Availability × Performance × Quality × 100
OEE (%) = 0.85 × 0.92 × 0.99 × 100
OEE = 77.42%
Tool changes, spindle faults, programming delays, and workpiece adjustments can influence equipment effectiveness.
5.6. Example 6 – OEE Calculation for a Multi-Machine Production Line
For an integrated manufacturing line, OEE should be calculated using line-level planned production time, output, and ideal cycle time.
Line OEE (%) = (Total Good Output × Ideal Line Cycle Time / Planned Production Time) × 100
This formula applies when the line produces a consistent product with a defined ideal cycle time.
Individual machine OEE percentages should not simply be multiplied together.
Where machines operate independently, their results require appropriately weighted aggregation rather than an unqualified arithmetic average.
5.7. Comparing OEE Results Across Different Equipment
Meaningful equipment comparisons require standardized downtime categories, reliable ideal cycle times, and consistent quality definitions.
Machines handling different products or production complexities may have substantially different achievable performance levels.
Consequently, comparisons should consider manufacturing context rather than percentages alone.
5.8. Interpreting OEE Calculation Results for Operational Decisions
OEE identifies performance gaps, while its individual components reveal where improvement efforts should concentrate.
Low availability suggests reliability intervention, poor performance indicates speed-related inefficiencies, and low quality highlights process-control deficiencies.
6. Understanding OEE Scores and Manufacturing Benchmarks
6.1. What Is a Good OEE Score?
A good OEE score depends on equipment design, manufacturing complexity, production stability, and operating conditions.
Consistent improvement against an established equipment baseline is generally more informative than achieving an arbitrary industry-wide percentage.
6.2. Understanding the Commonly Cited 85% OEE Benchmark
An 85% OEE score is frequently referenced as a world-class manufacturing benchmark.
However, it is a conventional reference point rather than a universally applicable engineering standard.
Its suitability depends on process characteristics, equipment constraints, and production requirements.
6.3. World-Class OEE and Its Practical Limitations
World-class OEE requires strong equipment reliability, stable production speeds, and minimal quality losses.
Achieving consistently high effectiveness can be challenging in high-mix manufacturing, batch operations, and equipment requiring frequent product changeovers.
6.4. OEE Score Interpretation From Low to High Performance
The following ranges provide illustrative interpretation rather than universal industry standards.
OEE Score General Interpretation Below 40% Substantial improvement potential 40–60% Significant production losses 60–75% Developing operational effectiveness 75–85% Strong performance in many applications Above 85% High effectiveness under suitable conditions
6.5. Typical OEE Challenges Across Manufacturing Industries
Food processing facilities encounter cleaning and changeover losses, while chemical plants experience process instability and mechanical reliability challenges.
Packaging facilities commonly face sensor faults and micro-stoppages.
Each industry requires equipment-specific loss classification.
6.6. Why a 100% OEE Score Is Rare in Real-World Production
Achieving 100% OEE requires uninterrupted equipment operation, ideal manufacturing speed, and zero defective products.
Normal equipment degradation, process variability, changeovers, and operational disturbances make sustained perfect effectiveness exceptionally difficult.
6.7. Setting Realistic OEE Targets for Different Equipment
Effective OEE targets should originate from historical performance, technical capability, and identified improvement opportunities.
Incremental targets encourage sustainable operational development without incentivizing unrealistic production speeds or compromised quality standards.
6.8. Comparing OEE Benchmarks Without Misleading Conclusions
Benchmark comparisons must account for production schedules, product complexity, ideal cycle time assumptions, and downtime classification.
Comparing fundamentally different manufacturing processes without normalization may produce misleading conclusions.

7. Major Causes of Low Overall Equipment Effectiveness
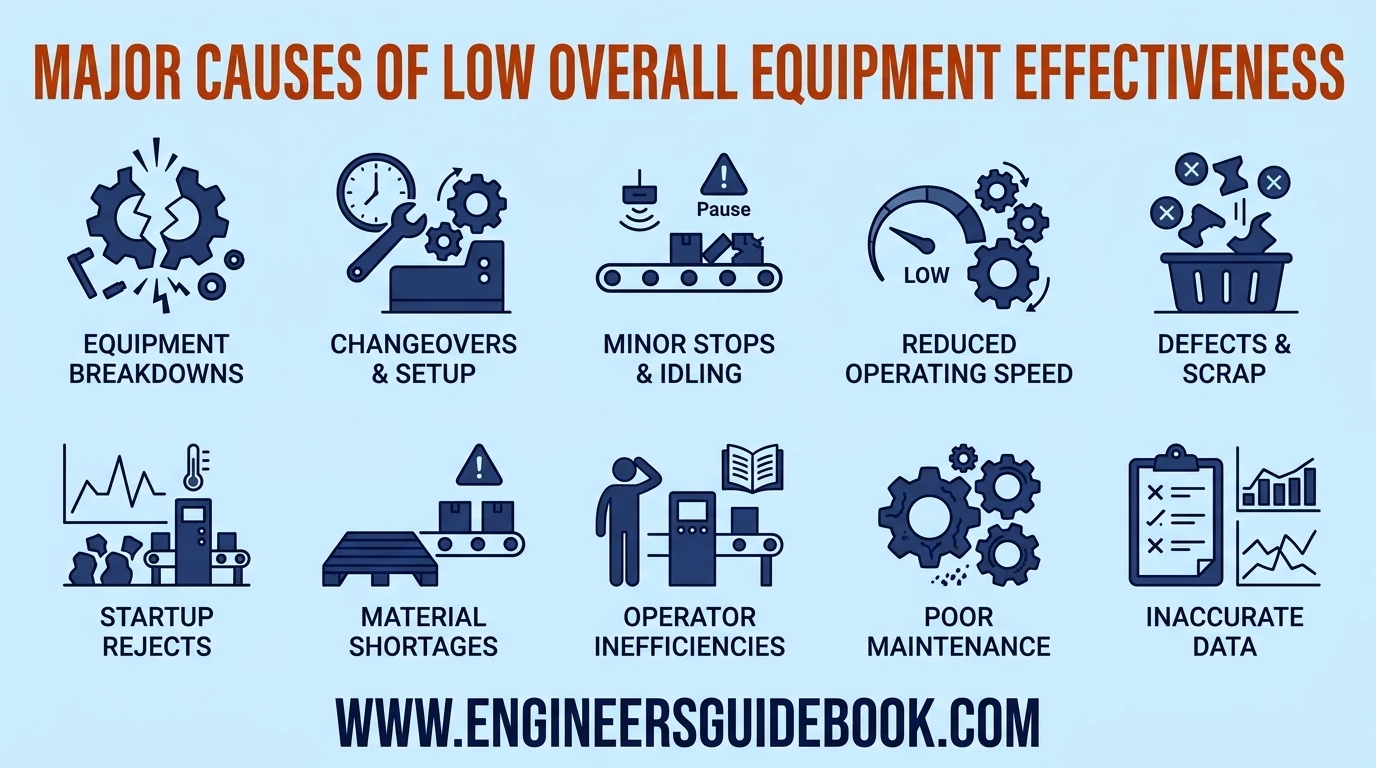
7.1. Unplanned Equipment Breakdowns and Mechanical Failures
Bearing deterioration, gearbox failures, conveyor malfunctions, and lubrication deficiencies cause unexpected production interruptions.
These failures primarily reduce equipment availability and can substantially increase corrective maintenance expenditure.
7.2. Planned Downtime and Changeover Losses
Changeovers, tool adjustments, and equipment cleaning reduce availability when performed during planned production time.
However, scheduled periods deliberately excluded from production should not automatically be classified as OEE losses.
7.3. Minor Stops, Idling, and Micro-Stoppages
Short-duration interruptions frequently escape traditional maintenance reporting.
Sensor misalignment, material accumulation, and intermittent feeding problems create cumulative performance losses despite relatively limited individual stoppage durations.
7.4. Reduced Operating Speed and Performance Losses
Machines operating below validated ideal speed generate performance losses.
Common causes include worn components, improper machine settings, insufficient material flow, and deteriorating mechanical transmission efficiency.
7.5. Product Defects, Rework, and Scrap Generation
Defective products reduce quality effectiveness even when manufacturing equipment operates continuously.
Dimensional deviations, incorrect filling quantities, sealing defects, and contamination contribute directly to manufacturing quality losses.
7.6. Startup Rejects and Process Stabilization Losses
Production startup frequently requires process stabilization.
Temperature fluctuations, machine calibration, material adjustments, and initial operating instability may generate rejected products before steady-state manufacturing conditions are achieved.
7.7. Material Shortages and Production Interruptions
Insufficient raw materials, delayed packaging components, and inconsistent material supply can interrupt scheduled production.
When these interruptions occur during planned production time, they typically reduce availability under standard OEE conventions.
7.8. Operator Inefficiencies and Standard Operating Procedure Gaps
Inadequate operator training, inconsistent machine adjustments, and poorly defined operating procedures can create repetitive production disturbances.
Standardized work instructions and competency development improve operational consistency and equipment performance.
7.9. Poor Preventive Maintenance and Equipment Deterioration
Ineffective preventive maintenance accelerates component degradation and increases unexpected failures.
Condition monitoring, lubrication management, timely inspections, and reliability-centered maintenance strategies help mitigate deterioration and recover lost equipment availability.
7.10. Incorrect Production Data and Misleading OEE Results
Inaccurate downtime records, incorrect cycle-time assumptions, and inconsistent production counts distort reported equipment effectiveness.
Automated data acquisition, standardized loss codes, operator verification, and regular performance audits improve measurement integrity.
Reliable OEE improvement begins with accurate measurement and disciplined interpretation of manufacturing losses.
8. How to Improve Overall Equipment Effectiveness
Improving Overall Equipment Effectiveness requires systematic elimination of availability, performance, and quality losses. Manufacturers should prioritize measurable improvements rather than simply increasing production speed.
8.1. Reduce Unplanned Downtime Through Preventive Maintenance
Preventive maintenance minimizes unexpected equipment failures through scheduled inspections, lubrication, adjustments, and component replacement.
Maintenance schedules should reflect operating hours, manufacturer recommendations, and historical failure patterns. Effective preventive maintenance improves equipment availability and reduces costly production interruptions.
8.2. Implement Predictive and Condition-Based Maintenance
Predictive maintenance uses equipment condition data to identify developing mechanical problems before catastrophic failure.
Vibration analysis, thermography, oil analysis, and ultrasonic monitoring help detect bearing deterioration, misalignment, lubrication deficiencies, and electrical abnormalities.
Condition-based interventions reduce unnecessary maintenance while improving operational reliability.
8.3. Apply Total Productive Maintenance Principles
Total Productive Maintenance (TPM) promotes shared responsibility for equipment effectiveness across maintenance, production, and management teams.
Its principles emphasize autonomous maintenance, planned maintenance, focused improvement, and operator competency.
TPM encourages proactive equipment care and systematic elimination of manufacturing losses.
8.4. Reduce Changeover Time Using SMED Techniques
Single-Minute Exchange of Die (SMED) reduces changeover duration through procedural optimization.
The methodology distinguishes internal setup activities requiring stopped equipment from external activities performed while machinery operates.
Standardized tooling, preparation checklists, and quick-release mechanisms can significantly improve availability.
8.5. Eliminate Minor Stops and Improve Equipment Reliability
Micro-stoppages frequently accumulate into substantial performance losses.
Typical causes include sensor misalignment, conveyor blockages, material feeding disturbances, and intermittent actuator faults.
Recording short interruptions and eliminating recurrent failure mechanisms helps restore productive operating time.
8.6. Optimize Machine Speed Without Sacrificing Product Quality
Operating equipment at excessive speeds can increase rejection rates and mechanical deterioration.
Manufacturers should establish validated operating parameters that balance throughput, process stability, and product quality.
Controlled speed optimization improves performance without creating disproportionate quality losses.
8.7. Reduce Manufacturing Defects Through Root Cause Analysis
Root Cause Analysis (RCA) identifies underlying mechanisms responsible for recurring product defects.
Techniques such as the 5 Whys, Fishbone Diagram, and Failure Mode and Effects Analysis help investigate process inconsistencies.
Effective corrective actions eliminate systemic causes rather than repeatedly treating symptoms.
8.8. Improve Operator Training and Autonomous Maintenance
Operators should receive practical training covering equipment operation, abnormality identification, basic inspections, and standardized troubleshooting.
Autonomous maintenance encourages operators to perform approved cleaning, inspection, and routine equipment care.
Qualified maintenance personnel must retain responsibility for hazardous or specialized interventions.
8.9. Apply Lean Manufacturing and Kaizen Principles
Lean Manufacturing eliminates non-value-adding activities, while Kaizen promotes continuous incremental improvement.
Together, these approaches reduce process waste, optimize material movement, and strengthen operational discipline.
Regular improvement workshops help convert employee observations into measurable equipment enhancements.
8.10. Improve Mean Time Between Failures and Mean Time to Repair
Mean Time Between Failures (MTBF) measures operating time between repairable equipment failures.
Mean Time to Repair (MTTR) measures average corrective repair duration.
Increasing MTBF and reducing MTTR generally improves equipment availability.
Reliability engineering, spare-parts readiness, and standardized troubleshooting support both objectives.
8.11. Prioritize OEE Improvement Opportunities Using Pareto Analysis
Pareto Analysis identifies dominant manufacturing loss categories.
By ranking downtime events, performance interruptions, and quality defects according to their operational impact, teams can prioritize improvement resources.
A small number of recurring problems frequently contribute disproportionately to overall productivity losses.
8.12. Establish Sustainable OEE Improvement Targets and Action Plans
OEE improvement plans should establish measurable objectives, responsible personnel, deadlines, and verification criteria.
Targets must consider historical equipment performance, process capabilities, and available resources.
Periodic performance reviews ensure implemented improvements remain sustainable.

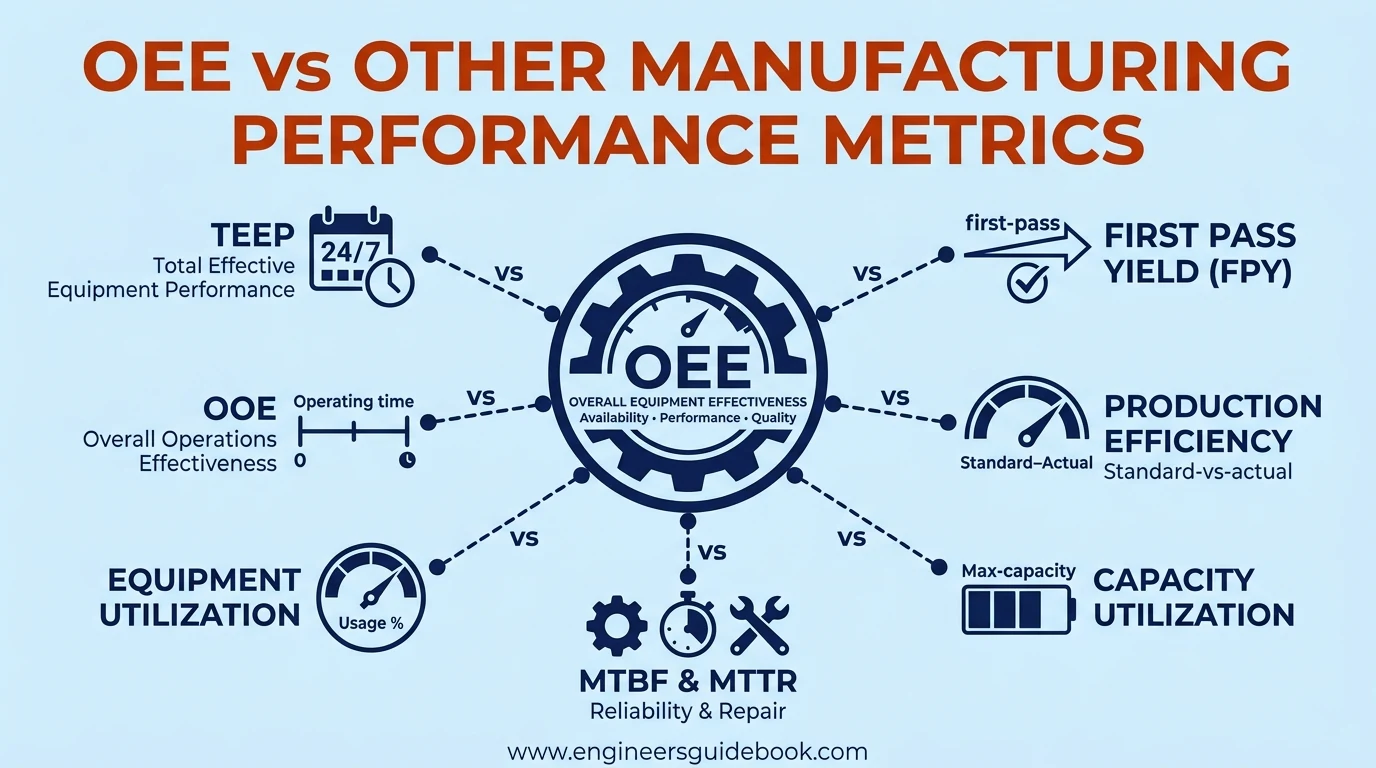
9. OEE vs Other Manufacturing Performance Metrics
OEE provides comprehensive equipment effectiveness measurement, but complementary manufacturing indicators reveal different aspects of operational performance.
9.1. OEE vs Overall Operations Effectiveness (OOE)
OEE evaluates effectiveness during planned production time.
Overall Operations Effectiveness (OOE) incorporates a broader operating-time basis, commonly including scheduled periods excluded from OEE.
Consequently, OOE provides additional insight into operational scheduling and equipment utilization.
9.2. OEE vs Total Effective Equipment Performance (TEEP)
Total Effective Equipment Performance (TEEP) measures fully productive time against total calendar time.
T E E P = O E E × L o a d i n g TEEP=OEE\times Loading T E E P = O E E × L o a d in g
Here, Loading represents planned production time divided by calendar time.
TEEP reveals additional capacity opportunities beyond scheduled manufacturing operations.
9.3. OEE vs Equipment Utilization
Equipment utilization measures how extensively available equipment capacity is scheduled or used.
OEE evaluates how effectively scheduled production time produces acceptable output.
High utilization does not necessarily indicate high manufacturing effectiveness.
9.4. OEE vs Production Efficiency
Production efficiency generally compares actual manufacturing output with an established production standard.
OEE additionally evaluates downtime and product quality.
Therefore, OEE offers a more comprehensive interpretation of equipment-related productivity.
9.5. OEE vs Capacity Utilization
Capacity utilization evaluates actual production relative to available production capacity over a defined period.
OEE focuses on effectiveness during planned manufacturing time.
Both indicators support production planning and investment decisions.
9.6. OEE vs Mean Time Between Failures (MTBF)
MTBF measures equipment reliability by evaluating average operating time between failures.
OEE measures combined availability, performance, and quality.
Improving MTBF can enhance OEE by reducing failure-related downtime.
9.7. OEE vs Mean Time to Repair (MTTR)
MTTR indicates average corrective repair duration.
Reducing MTTR minimizes downtime associated with equipment failures.
However, shorter repairs alone cannot eliminate production speed losses or manufacturing defects.
9.8. OEE vs First Pass Yield (FPY)
First Pass Yield measures products meeting quality requirements without rework.
OEE incorporates a comparable quality measure alongside availability and performance.
FPY is particularly useful for identifying process defects and manufacturing instability.
9.9. Choosing the Right Manufacturing KPIs Alongside OEE
A balanced manufacturing dashboard should include OEE, MTBF, MTTR, downtime, production output, rejection rate, and maintenance compliance.
These complementary indicators provide diagnostic context and support evidence-based operational decisions.
10. OEE Monitoring Tools, Calculators, and Dashboards
10.1. Manual OEE Calculation Using Production Log Sheets
Manual OEE tracking uses production sheets to record scheduled time, operating duration, manufactured quantities, and defects.
Although economical, manual systems require disciplined data recording and verification.
10.2. Creating an OEE Calculator in Microsoft Excel
Microsoft Excel supports automated OEE calculation through structured tables and formulas.
Users can calculate availability, performance, quality, and overall effectiveness while incorporating charts for performance comparisons.
Standardized templates reduce repetitive calculation errors.
10.3. Building an Automated OEE Dashboard in Power BI
Power BI enables interactive monitoring of manufacturing performance across machines, shifts, and production lines.
DAX measures calculate key indicators, while visualizations reveal downtime trends, quality losses, and equipment performance.
10.4. Real-Time OEE Monitoring Using PLC and SCADA Systems
Programmable Logic Controllers (PLCs) collect equipment operating signals, production counts, and machine status information.
Supervisory Control and Data Acquisition (SCADA) systems visualize these signals and support real-time monitoring.
Reliable signal interpretation remains essential for accurate OEE calculation.
10.5. Integrating OEE Tracking With Manufacturing Execution Systems
Manufacturing Execution Systems (MES) connect equipment performance with production orders, product specifications, and manufacturing schedules.
This integration enables detailed loss categorization and production traceability.
10.6. Using Industrial IoT Sensors for Automated Data Collection
Industrial Internet of Things (IIoT) devices collect machine status, cycle counts, vibration, temperature, and other operational parameters.
Automated acquisition minimizes manual intervention and improves data granularity.
10.7. Essential KPIs and Visualizations for an OEE Dashboard
Effective dashboards should display OEE, availability, performance, quality, downtime duration, and production losses.
Pareto charts, trend graphs, and equipment comparison tables help identify improvement priorities.
10.8. Daily, Weekly, and Monthly OEE Performance Reporting
Daily reports identify immediate abnormalities, while weekly reviews reveal recurring operational issues.
Monthly reporting supports management evaluation, resource allocation, and long-term performance assessment.
10.9. Selecting the Right OEE Monitoring Software
Software selection should consider equipment connectivity, reporting flexibility, scalability, cybersecurity, integration capabilities, and total ownership cost.
Systems should support accurate data capture without introducing unnecessary operational complexity.
10.10. Ensuring Data Accuracy and Consistency in OEE Reporting
Accurate OEE reporting requires standardized downtime codes, validated cycle times, synchronized timestamps, and consistent quality classifications.
Periodic audits help identify missing records and measurement discrepancies.

11. Best Practices for Implementing OEE in Manufacturing Plants
11.1. Establish Clear OEE Measurement Objectives
Organizations should define whether OEE monitoring primarily targets downtime reduction, throughput improvement, quality enhancement, or capacity optimization.
Clear objectives establish measurable implementation priorities.
11.2. Define Consistent Production Time and Downtime Categories
Standardized definitions prevent inconsistencies between shifts and departments.
Organizations should document planned production periods, excluded breaks, breakdowns, changeovers, and minor stoppages.
11.3. Select Appropriate Equipment and Production Lines for OEE Tracking
Initial implementation should prioritize critical machinery, production bottlenecks, or equipment exhibiting substantial operational losses.
Pilot programs enable refinement before plant-wide deployment.
11.4. Standardize Ideal Cycle Time and Production Count Definitions
Ideal cycle times should reflect validated equipment capabilities.
Total production counts must consistently include acceptable and rejected products.
These definitions directly influence OEE accuracy.
11.5. Distinguish Planned Stops From Availability Losses
Scheduled nonproduction periods should be distinguished from stoppages occurring during planned production.
Planned maintenance conducted during scheduled production time can reduce availability, depending on the documented measurement convention.
11.6. Account for Product Mix and Variable Production Speeds
Manufacturing lines frequently handle products with different operating speeds.
Product-specific ideal cycle times prevent misleading performance calculations during mixed-product production.
11.7. Develop Standardized OEE Data Collection Procedures
Standard operating procedures should define data sources, recording frequency, downtime classifications, and verification responsibilities.
Consistent documentation improves comparability and traceability.
11.8. Assign OEE Monitoring Responsibilities Across Departments
Production teams record operating data, maintenance personnel investigate equipment failures, and quality teams validate acceptable output.
Cross-functional ownership improves accountability.
11.9. Conduct Daily OEE Reviews and Cross-Functional Meetings
Short operational reviews should examine major losses, recurring abnormalities, and outstanding corrective actions.
Discussion should concentrate on evidence, accountability, and measurable improvements.
11.10. Avoid Common OEE Implementation and Reporting Mistakes
Common implementation errors include unrealistic targets, manipulated downtime classifications, incomplete production records, and inconsistent operating standards.
OEE should facilitate improvement rather than encourage misleading performance reporting.
11.11. Align OEE Improvement With Maintenance and Production Strategies
Maintenance planning and production scheduling should share common equipment effectiveness objectives.
Integrated planning minimizes unnecessary interruptions and improves operational coordination.
11.12. Build a Continuous Improvement Culture Through OEE Monitoring
Sustainable OEE improvement requires management commitment, employee participation, transparent reporting, and consistent follow-up.
Recognizing measurable improvements strengthens engagement and operational ownership.

12. Frequently Asked Questions About OEE
12.1. What Does OEE Stand for in Manufacturing?
OEE stands for Overall Equipment Effectiveness. It measures equipment productivity during planned production time by combining availability, performance, and quality into one percentage.
12.2. What Is the Formula for Overall Equipment Effectiveness?
The standard formula is OEE = Availability × Performance × Quality . Multiply the three decimal values and convert the result into a percentage.
12.3. How Do You Calculate OEE Step by Step?
First, determine planned production time and equipment runtime. Next, calculate availability, performance, and quality using production data. Finally, multiply the three decimal ratios.
12.4. What Are the Three Factors of OEE?
The three factors are availability, performance, and quality. They represent equipment operating time, production speed, and acceptable manufacturing output.
12.5. What Is a Good OEE Percentage?
A good OEE percentage depends on manufacturing complexity, equipment capability, and operating conditions. Consistent improvement against realistic historical benchmarks is more meaningful than an arbitrary target.
12.6. Is 85% OEE Considered World Class?
An 85% OEE score is commonly described as world-class performance. However, this benchmark is not universally applicable to every manufacturing process.
12.7. Can OEE Be Higher Than 100%?
Correctly calculated OEE cannot exceed 100% when ideal cycle times and production data are valid. Higher results generally indicate inaccurate standards, inconsistent measurements, or calculation errors.
12.8. How Do You Calculate OEE for an Eight-Hour Shift?
Determine planned production minutes after excluding designated nonproduction periods. Calculate runtime, production performance, and acceptable output, then multiply availability, performance, and quality.
12.9. What Is the Difference Between OEE and Machine Efficiency?
Machine efficiency may describe output or resource conversion efficiency. OEE specifically combines availability, performance, and quality to evaluate effective manufacturing production.
12.10. Does OEE Include Planned Maintenance Downtime?
Planned maintenance affects OEE when conducted during planned production time. Maintenance scheduled outside planned production time is normally excluded from the OEE denominator.
12.11. How Do You Calculate OEE for Multiple Machines?
Calculate individual equipment OEE using consistent definitions. For aggregate reporting, use appropriate production-time weighting or validated line-level calculations rather than simply averaging percentages.
12.12. What Are the Six Big Losses in OEE?
The Six Big Losses are breakdowns, setup and adjustments, minor stoppages, reduced speed, process defects, and startup yield losses.
12.13. How Can Manufacturers Improve OEE Quickly?
Manufacturers can improve OEE by addressing recurring stoppages, correcting machine settings, reducing changeover delays, and eliminating frequent defects.
Pareto Analysis helps identify high-impact opportunities.
12.14. How Often Should OEE Be Calculated?
OEE can be calculated continuously, per shift, daily, weekly, or monthly.
Real-time monitoring supports immediate operational intervention, while periodic reports enable trend analysis.
12.15. Can OEE Be Calculated Automatically Using Excel or Power BI?
Yes. Excel calculates OEE using spreadsheet formulas, while Power BI supports automated calculations, interactive dashboards, historical comparisons, and integration with production datasets.

13. Conclusion
13.1. Key Takeaways From the OEE Formula and Calculation Process
Overall Equipment Effectiveness combines availability, performance, and quality to measure productive manufacturing time.
Accurate calculations help distinguish equipment downtime, operating-speed losses, and defective production.
13.2. Why Accurate OEE Measurement Is Essential for Manufacturing Excellence
Reliable OEE measurement creates transparency across manufacturing operations.
Standardized data collection enables meaningful benchmarking, effective maintenance prioritization, and informed operational decision-making.
13.3. Turning OEE Data Into Actionable Equipment Improvement Strategies
OEE delivers value when performance findings translate into corrective actions.
Maintenance optimization, root cause analysis, process standardization, and quality improvement transform production measurements into tangible operational benefits.
13.4. Building Long-Term Production Reliability and Operational Efficiency
Long-term manufacturing excellence requires continuous monitoring, proactive maintenance, employee involvement, and disciplined improvement execution.
By combining accurate OEE calculations with systematic loss elimination, manufacturers can improve equipment reliability, increase productive capacity, reduce operating costs, and establish sustainable operational competitiveness.