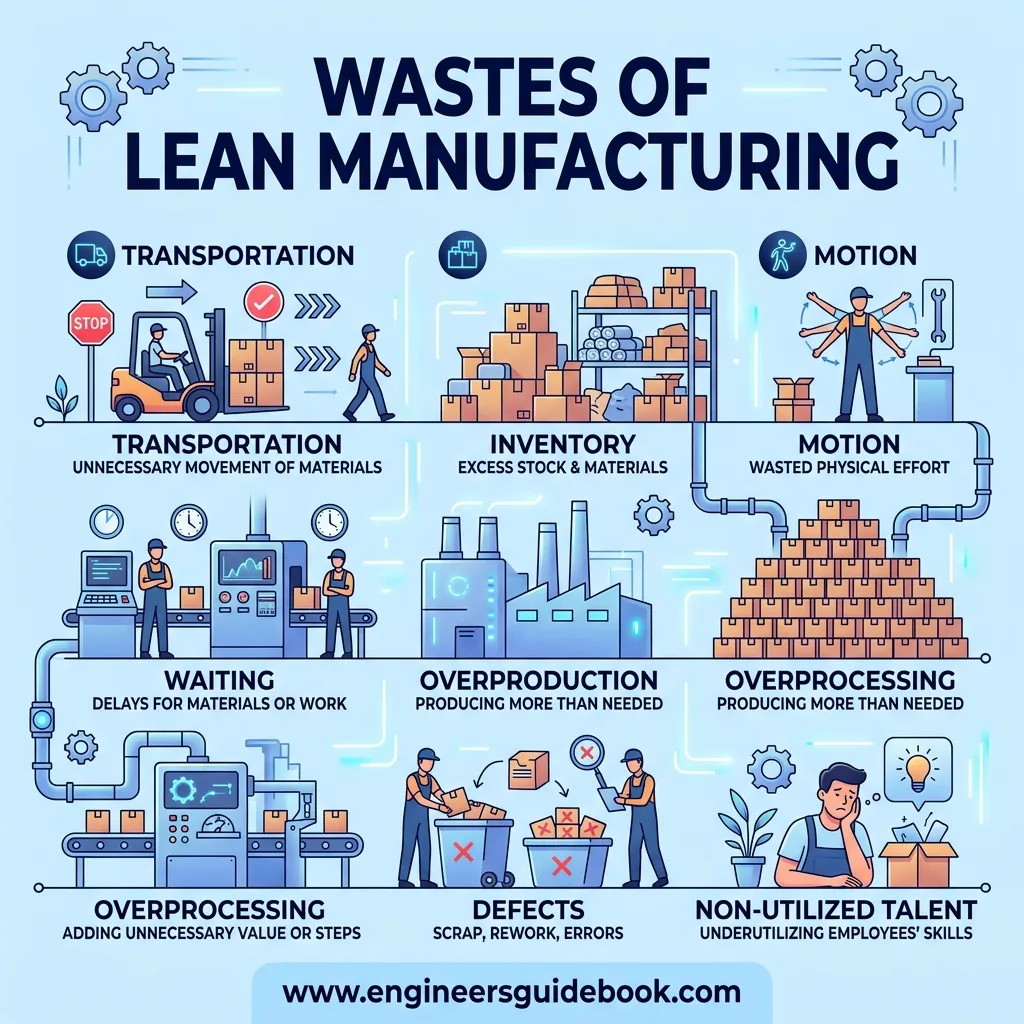
The 8 wastes of lean manufacturing are transportation, inventory, motion, waiting, overproduction, overprocessing, defects, and unused skills. These wastes consume time, labor, space, materials, and capital without increasing customer value. Identifying and eliminating them helps organizations improve flow, reduce operating costs, shorten lead times, increase quality, and build more efficient production systems.
1. Eight Wastes Overview
1.1 What Are the 8 Wastes of Lean Manufacturing
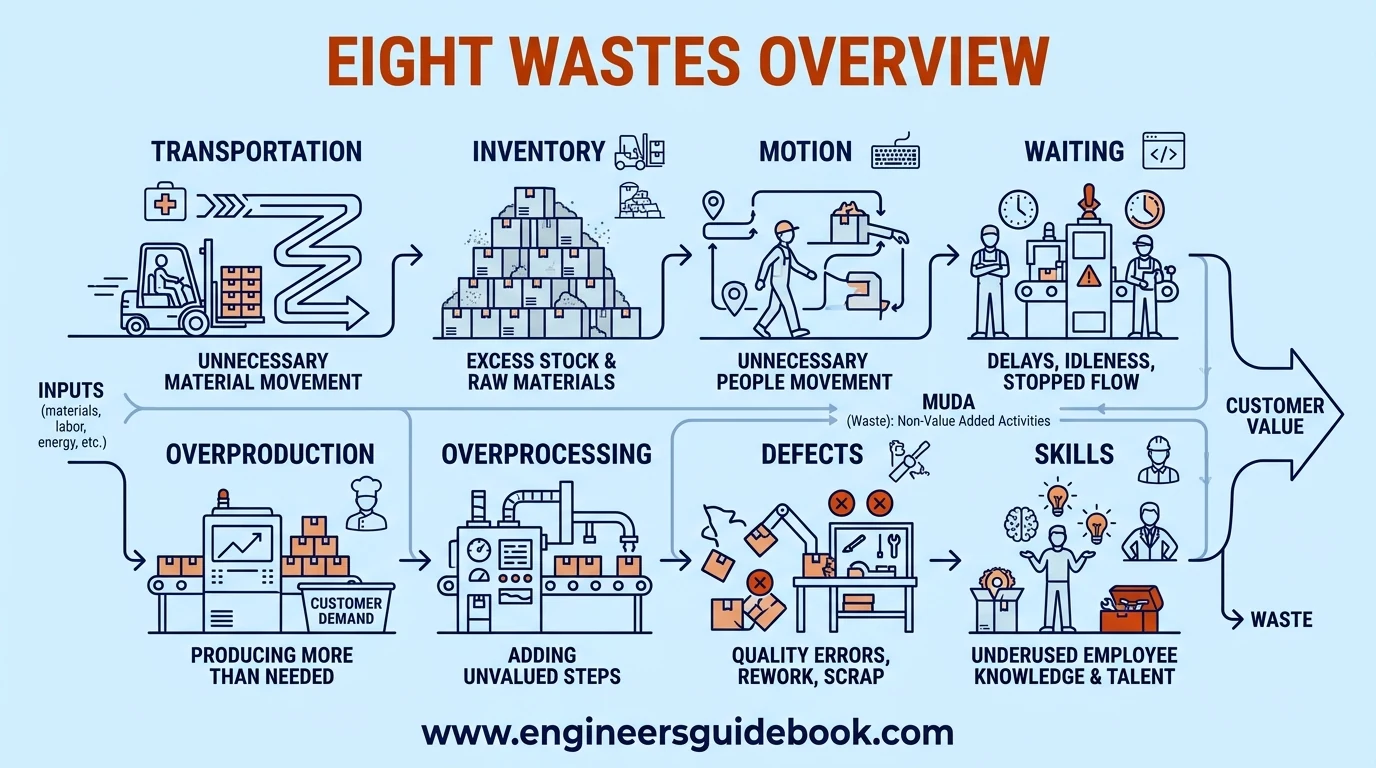
The 8 wastes of lean manufacturing are categories of activities that consume resources without creating value from the customer’s perspective. They include transportation, inventory, motion, waiting, overproduction, overprocessing, defects, and unused employee skills.
Waste can occur in a single workstation or across an entire value stream. A component moved unnecessarily between departments, an operator waiting for material, or a product manufactured before demand exists all represent lost productive capacity.
Lean manufacturing attempts to make these losses visible so they can be systematically reduced.
1.2 Why Waste Reduction Matters
Waste reduction improves how effectively an organization converts labor, materials, equipment, and capital into customer value.
When unnecessary activities are removed, production cycles become shorter and operating costs decline. Employees spend more time performing productive tasks instead of searching, waiting, transporting, correcting, or repeating work.
Reducing waste also improves operational predictability. Processes become easier to control because fewer interruptions, bottlenecks, and hidden inefficiencies distort normal production flow.
1.3 TIMWOODS Framework
TIMWOODS is a mnemonic commonly used to remember the eight lean wastes.
It represents Transportation, Inventory, Motion, Waiting, Overproduction, Overprocessing, Defects, and Skills.
The framework gives employees a practical lens for examining daily operations. During a Gemba walk, for example, observers can deliberately search for excessive movement, accumulated inventory, idle operators, redundant processing, or underused employee capability.
This structured approach transforms waste identification from an abstract concept into an observable operational practice.
1.4 Value Added and Non Value Added Activities
A value-added activity changes a product or service in a way the customer is willing to pay for. Machining a component to its required dimensions, assembling a product, or applying a required finish can therefore create value.
Non-value-added activities consume resources without improving the product from the customer’s perspective.
Some are pure waste and can be eliminated. Others, such as regulatory inspections or required documentation, may currently be necessary even though they do not directly create customer value.
Lean improvement focuses on maximizing value-added work while minimizing unnecessary activity.
1.5 Three Categories of Lean Waste
Lean thinking often considers three interconnected sources of operational inefficiency known as Muda, Mura, and Muri.
Muda refers to activities that consume resources without adding value. The eight wastes primarily fall within this category.
Mura describes unevenness, such as fluctuating workloads, irregular production schedules, or inconsistent material supply.
Muri refers to overburden placed on people or equipment.
These conditions frequently reinforce one another. Uneven scheduling can create overloaded machines, which then causes breakdowns, delays, defects, and additional waste.
2. Transportation Waste
2.1 Transportation Waste Definition
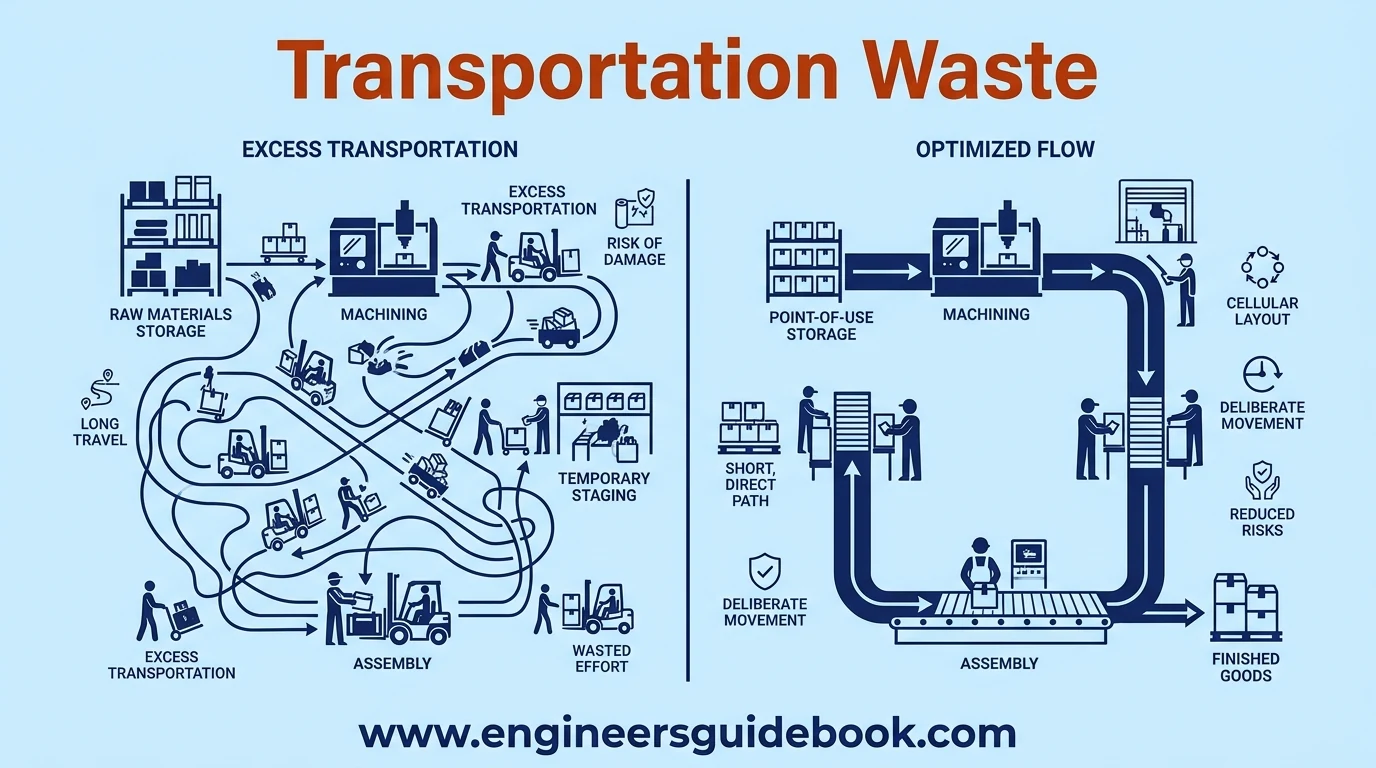
Transportation waste occurs when materials, products, documents, tools, or information are moved more than necessary.
Transportation itself does not normally transform the product, yet it requires labor, time, equipment, floor space, and energy.
Every additional movement also introduces risk. Components may become damaged, contaminated, mixed, misplaced, or delayed while being transferred between locations.
2.2 Common Causes of Excess Transportation
Excess transportation often originates from fragmented processes, departmental layouts, centralized storage, poor production planning, and distant inspection areas.
A component may travel from machining to inspection, then to temporary storage, and later to assembly.
Individually, each movement may appear reasonable. Collectively, however, the travel creates a circuitous material flow that increases lead time without improving the product.
2.3 Material Movement in Manufacturing
Material movement includes forklift transportation, conveyor transfers, trolley movement, pallet handling, crane operations, and manual carrying.
Some movement is unavoidable, but lean manufacturing seeks the shortest practical path between consecutive operations.
Production equipment positioned according to process sequence can dramatically reduce travel distance. When materials move continuously from one value-adding operation to the next, handling requirements decline and production flow becomes more transparent.
2.4 Poor Facility Layout
A poorly designed facility can institutionalize transportation waste.
Machines grouped only by equipment type may force products to travel repeatedly between distant departments. Raw materials may also be stored far from their point of use.
These layouts create long travel routes, congested aisles, additional material-handling requirements, and complicated scheduling.
Cellular layouts and point-of-use storage can reduce this physical separation by positioning related processes closer together.
2.5 Excessive Handling Between Processes
Repeated loading, unloading, staging, transferring, and restacking are common forms of excessive handling.
For example, finished components may be placed in a container, moved to temporary storage, transferred to another pallet, and later delivered to assembly.
Each handling event consumes time without enhancing the product. It also raises the probability of scratches, deformation, contamination, identification errors, and ergonomic strain.
Reducing intermediate storage and improving process connectivity can eliminate many of these transfers.
2.6 Transportation Waste Examples
Typical examples include forklifts repeatedly carrying material across a factory, parts moving to distant inspection rooms, documents circulating through several offices, and products being transferred between multiple temporary storage locations.
Another example occurs when packaging materials are stored in a remote warehouse and delivered several times per shift.
A more efficient system might position frequently used materials near the production line and replenish them according to actual consumption.
2.7 Transportation Waste Identification
Transportation waste can be identified through direct observation, travel-distance measurement, material-flow mapping, and spaghetti diagrams.
A spaghetti diagram traces the actual movement of materials or people across a workspace.
If the resulting path contains long routes, repeated crossings, backtracking, or unnecessary transfers, improvement opportunities are likely present.
Tracking forklift trips, handling frequency, and distance traveled can also reveal transportation activities that have become normalized over time.
2.8 Transportation Waste Reduction
Transportation waste can be reduced through improved layout, cellular manufacturing, point-of-use storage, standardized routes, and better process sequencing.
Frequently connected operations should be positioned close together whenever practical.
Smaller transfer quantities can also support smoother flow by reducing the need for large staging areas.
The objective is not to eliminate all transportation. It is to ensure that every required movement is deliberate, economical, and as short as reasonably possible.
3. Inventory Waste
3.1 Inventory Waste Definition
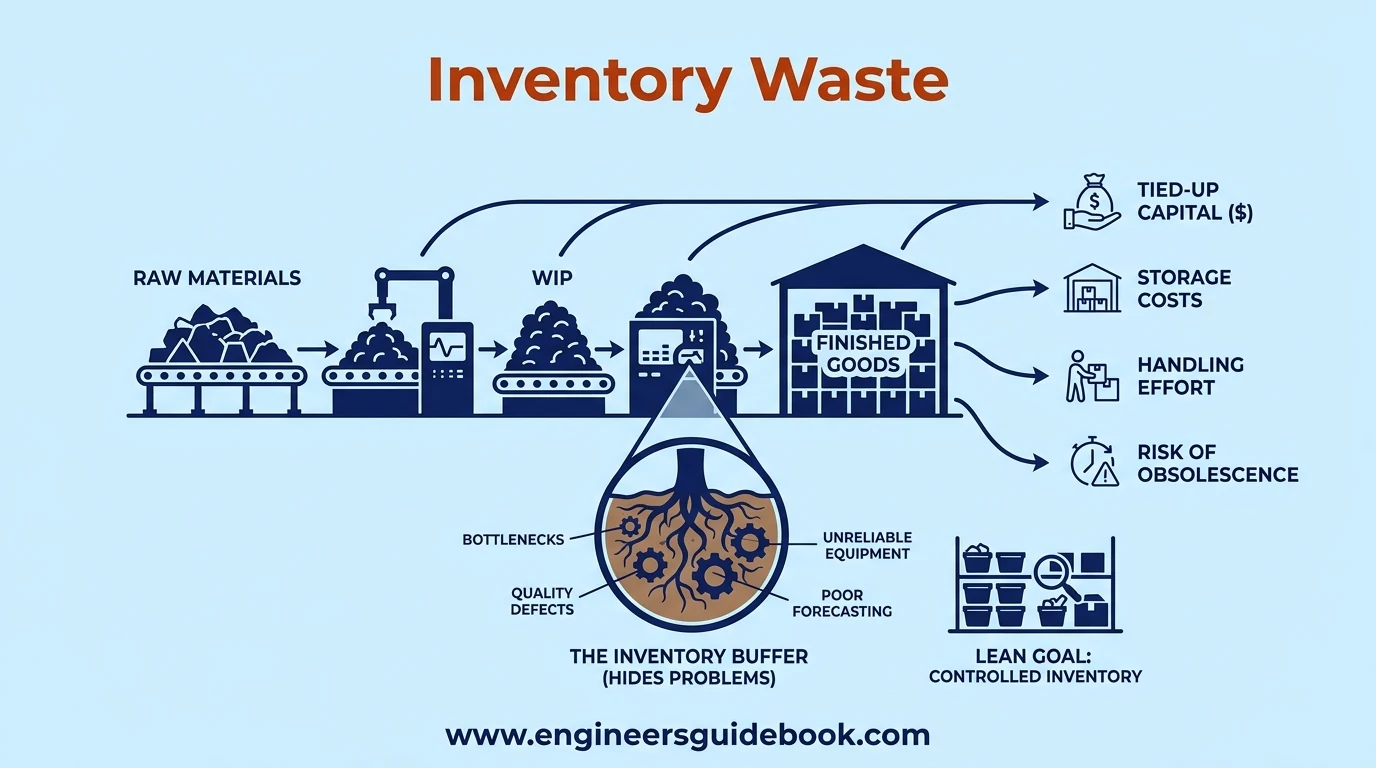
Inventory waste refers to materials, work in process, or finished goods held beyond what is required for current operations or customer demand.
Inventory may appear reassuring because it provides a buffer against uncertainty. Excessive quantities, however, consume capital, occupy space, increase handling, and conceal underlying process problems.
Lean systems therefore seek controlled inventory rather than indiscriminate stock reduction.
3.2 Raw Material Inventory
Excess raw material often results from large purchase quantities, unreliable suppliers, poor forecasting, or attempts to obtain volume discounts.
Although bulk purchasing may reduce unit price, the organization must still store, inspect, move, manage, and finance that inventory.
Materials may also deteriorate, expire, corrode, or become obsolete before consumption.
Reliable suppliers and demand-based replenishment can reduce unnecessary raw material accumulation.
3.3 Work in Process Inventory
Work in process inventory consists of partially completed products waiting between operations.
Large WIP levels often indicate imbalanced production rates, bottlenecks, excessive batch sizes, or unreliable machinery.
When WIP accumulates, lead times increase because products spend more time waiting than being processed.
Reducing batch sizes, balancing workloads, and improving process reliability can create smoother flow with less material trapped between operations.
3.4 Finished Goods Inventory
Finished goods inventory becomes waste when production significantly exceeds near-term customer demand.
These products require warehouse space, counting, handling, insurance, and working capital. Demand changes may also make finished goods obsolete before sale.
Pull-based production systems attempt to align output more closely with actual consumption so products are manufactured because they are required rather than merely because capacity is available.
3.5 Causes of Excess Inventory
Common causes include inaccurate forecasts, long changeover times, unreliable equipment, minimum order quantities, large batch production, supplier uncertainty, and poor communication between departments.
Inventory frequently acts as a protective buffer.
Instead of accepting the buffer as permanent, lean manufacturing investigates why protection is required. Solving the underlying instability often allows inventory to be reduced without jeopardizing customer service.
3.6 Hidden Costs of Inventory
Inventory costs extend far beyond purchase price.
Storage space, racks, forklifts, insurance, counting, security, deterioration, damage, obsolescence, and administrative effort all increase carrying cost.
Excess stock can also conceal quality problems and production imbalance. Defects may remain unnoticed inside large batches, while bottlenecks become obscured by piles of material.
Lower inventory makes operational abnormalities easier to detect.
3.7 Inventory Waste Examples
Examples include warehouses filled with slow-moving spare parts, months of packaging material stored beside production, large queues of semi-finished components between machines, and finished products manufactured without confirmed demand.
Another example is purchasing an annual supply of a component solely to obtain a lower unit price, despite high storage and obsolescence costs.
Such decisions should consider total cost rather than purchase price alone.
3.8 Inventory Waste Reduction
Inventory waste can be reduced through Kanban, pull production, smaller batches, supplier coordination, accurate demand planning, shorter setup times, and improved equipment reliability.
ABC analysis can help differentiate critical stock from low-value or slow-moving items.
The objective is to maintain enough inventory to support dependable operations while avoiding unnecessary accumulation that masks inefficiency.
4. Motion Waste
4.1 Motion Waste Definition
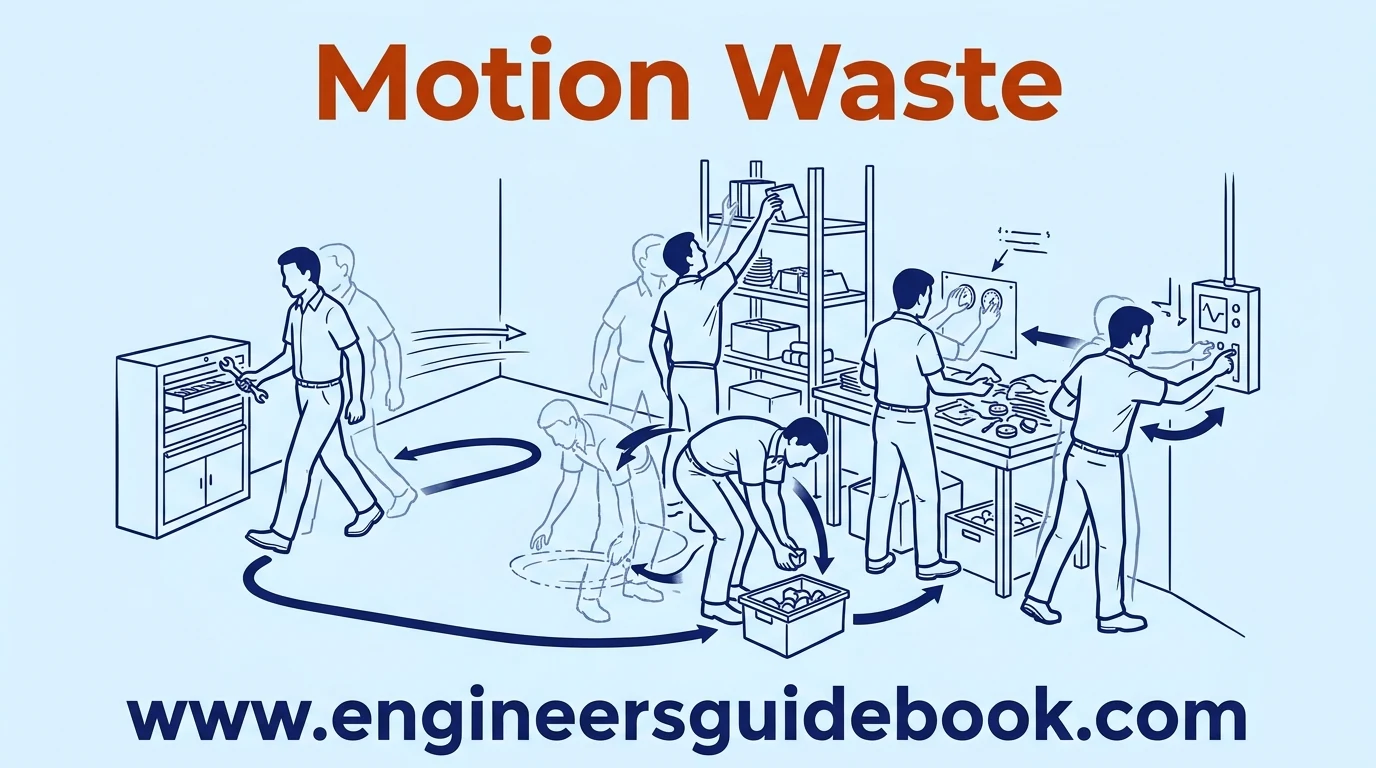
Motion waste is unnecessary physical movement performed by employees while completing their work.
Examples include walking, reaching, bending, turning, stretching, searching, or repeatedly changing position.
Unlike transportation waste, which concerns movement of materials or products, motion waste primarily concerns movement of people.
4.2 Motion and Transportation Differences
Motion and transportation are closely related but distinct.
An operator walking ten meters to retrieve a wrench is motion waste. A forklift carrying a pallet ten meters farther than necessary is transportation waste.
Both consume time without creating value.
Distinguishing between them helps improvement teams select appropriate countermeasures, such as ergonomic workstation redesign for motion or layout optimization for transportation.
4.3 Unnecessary Walking
Operators frequently walk unnecessarily because tools, materials, controls, printers, gauges, or components are positioned far from the workstation.
A few additional steps per cycle may appear insignificant.
Repeated hundreds of times each shift, however, these movements can consume substantial labor hours.
Point-of-use storage and workstation redesign can place frequently used items within convenient reach.
4.4 Reaching and Bending
Frequent reaching, bending, twisting, or stretching indicates poor workstation ergonomics.
These motions increase cycle time and may contribute to fatigue or musculoskeletal strain.
Work surfaces, bins, fixtures, controls, and tools should therefore be positioned according to task frequency and ergonomic principles.
Reducing awkward movement improves both productivity and employee comfort.
4.5 Poor Workplace Organization
Disorganized workplaces create motion because employees must navigate clutter, move objects, open multiple cabinets, or search different locations for required items.
A well-implemented 5S system establishes designated locations for tools and materials.
When the workplace becomes visually organized, employees can identify missing items immediately and complete routine tasks with fewer unnecessary movements.
4.6 Tool and Material Searching
Searching is one of the most common forms of motion waste.
Operators may search for spanners, gauges, drawings, cleaning equipment, spare parts, or production materials because storage locations are inconsistent.
Shadow boards, labeling, visual controls, standardized storage, and point-of-use placement reduce searching time and make abnormalities immediately visible.
4.7 Motion Waste Examples
Examples include an assembler repeatedly turning around to collect components, a technician walking to a distant tool room for common tools, or an operator bending to floor-level containers during every cycle.
Office employees can experience similar waste when navigating several systems to locate documents.
The physical environment differs, but the inefficiency is the same.
4.8 Motion Waste Reduction
Motion waste can be reduced through ergonomic workstation design, 5S, standardized work, point-of-use storage, visual management, and systematic observation.
Spaghetti diagrams can also track operator movement.
The most effective improvements often involve small physical changes, such as repositioning a bin, moving a control panel, or relocating frequently used tools.
5. Waiting Waste
5.1 Waiting Waste Definition
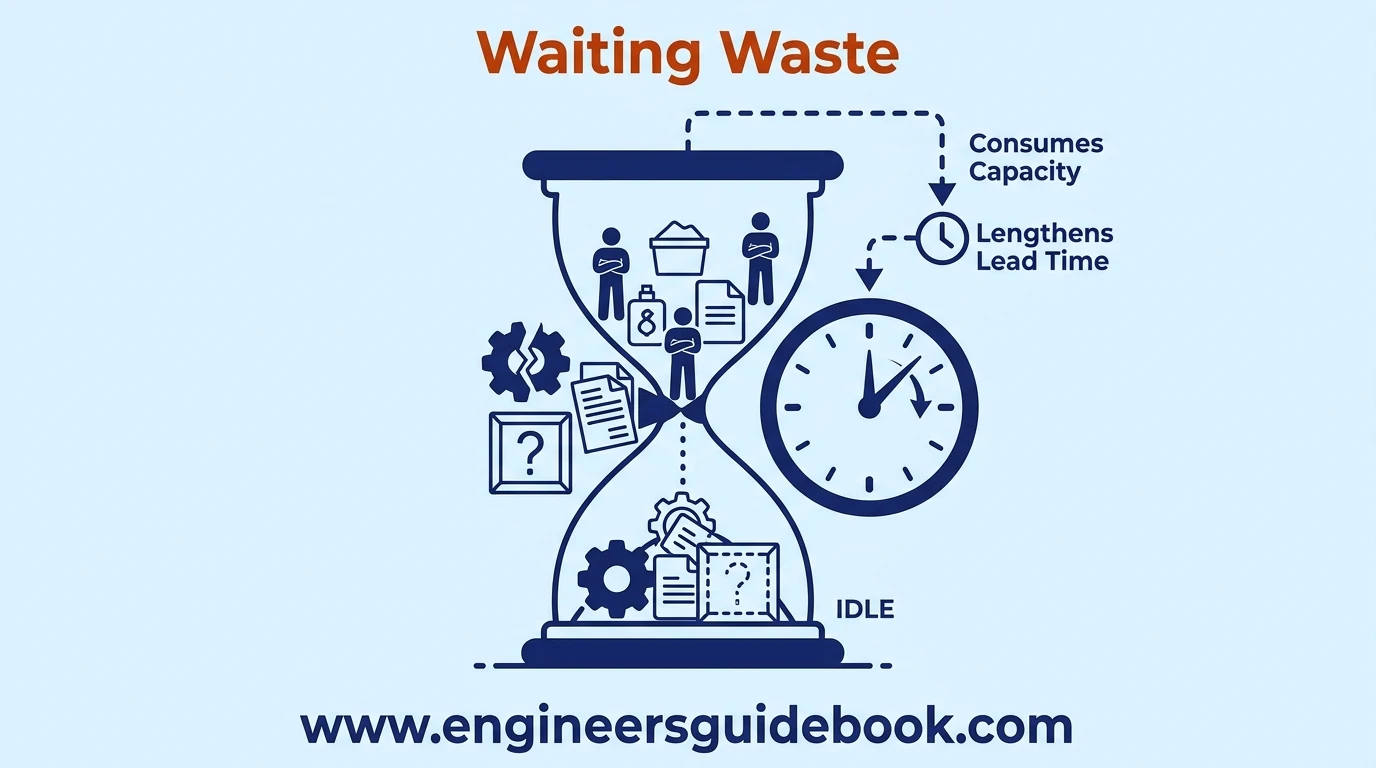
Waiting waste occurs whenever people, materials, information, or equipment remain idle because the next required activity cannot begin.
Although waiting may appear passive, it consumes available capacity and lengthens lead time.
Common causes include breakdowns, bottlenecks, missing materials, approvals, quality checks, and poorly synchronized operations.
5.2 Machine Downtime
Equipment breakdowns create waiting when operators cannot continue production.
Unplanned downtime may originate from inadequate preventive maintenance, worn components, poor lubrication, incorrect operation, or delayed spare-part availability.
Total Productive Maintenance can reduce this waste by improving equipment reliability and involving operators in routine equipment care.
5.3 Material Shortages
Production stops when required raw materials, components, packaging, or consumables are unavailable.
Material shortages may result from inaccurate inventory records, delayed suppliers, poor scheduling, or ineffective replenishment systems.
Kanban systems and clear minimum stock levels can help ensure that required materials arrive when needed without generating excessive inventory.
5.4 Process Bottlenecks
A bottleneck occurs when one process has less effective capacity than surrounding operations.
Upstream processes then produce faster than the bottleneck can absorb, causing queues and waiting.
Capacity analysis, line balancing, equipment improvement, and workload redistribution can reduce these delays.
Improving a non-bottleneck process provides limited benefit if the real constraint remains unresolved.
5.5 Approval Delays
Waiting is not confined to production equipment.
Purchase requests, engineering changes, quality approvals, permits, invoices, and maintenance decisions may remain idle within administrative workflows.
Excessive approval layers can increase lead time without improving control.
Clear authority levels and simplified workflows can shorten these delays.
5.6 Operator Waiting Time
Operators may wait for machines to complete automatic cycles, for technicians to repair equipment, or for supervisors to issue instructions.
Standardized work can help redistribute tasks so employees perform useful activities during unavoidable machine cycles.
The goal is not constant activity at any cost, but productive synchronization between people and equipment.
5.7 Waiting Waste Examples
Examples include a packaging line stopped while waiting for labels, an operator standing beside a malfunctioning machine, parts waiting for quality inspection, or maintenance technicians waiting for a work permit.
Office examples include employees waiting several days for routine approvals.
These delays add no value yet extend total process time.
5.8 Waiting Waste Reduction
Waiting can be reduced through preventive maintenance, balanced workloads, standardized processes, better scheduling, faster approvals, visual management, and dependable material replenishment.
Analyzing cycle times across connected processes can reveal where queues originate.
Removing the root cause is generally more effective than simply adding buffers.
6. Overproduction Waste
6.1 Overproduction Waste Definition
Overproduction means producing more than required, earlier than required, or faster than downstream processes or customers need.
It is particularly damaging because it frequently generates other wastes, including inventory, transportation, storage, handling, and defects.
Producing something efficiently does not create value if nobody currently needs it.
6.2 Producing Too Early
Producing before demand exists creates inventory that must wait for future consumption.
Early production may result from rigid schedules, long setup times, or efforts to keep equipment continuously busy.
Lean manufacturing instead favors production aligned with actual consumption.
6.3 Producing Too Much
Producing quantities above demand ties up materials and working capital.
Large quantities also increase the consequences of quality problems because many defective units may be produced before the issue is discovered.
Matching output with actual customer requirements prevents unnecessary accumulation.
6.4 Large Batch Production
Large batches are often used because changeovers are lengthy or inconvenient.
However, large batches increase WIP, extend lead times, and delay feedback.
Techniques such as Single Minute Exchange of Die reduce setup time, making smaller and more frequent production runs economically viable.
6.5 Forecast Driven Production
Forecasts are useful planning tools, but producing exclusively against uncertain forecasts can create substantial excess stock.
Demand may change due to seasonality, customer behavior, market conditions, or product modifications.
Pull systems use actual demand signals to initiate replenishment and reduce dependence on speculative production.
6.6 Consequences of Overproduction
Overproduction consumes raw materials, machine hours, labor, storage space, and cash before demand exists.
It can also hide process problems beneath high inventory levels.
Perhaps most importantly, it creates the illusion of productivity while resources are being spent on products that may not generate immediate value.
6.7 Overproduction Waste Examples
Examples include manufacturing 5,000 units when confirmed demand is 3,000, printing documents months before they are required, or producing upstream components faster than assembly can consume them.
Another example is continuing production simply because a machine has unused capacity.
Capacity utilization should never become more important than customer demand.
6.8 Overproduction Waste Reduction
Overproduction can be reduced through pull production, Kanban, takt time, smaller batches, improved forecasting, reduced setup time, and closer synchronization with customer demand.
Production targets should reflect consumption rather than encouraging output merely to maximize equipment utilization.
7. Overprocessing Waste
7.1 Overprocessing Waste Definition
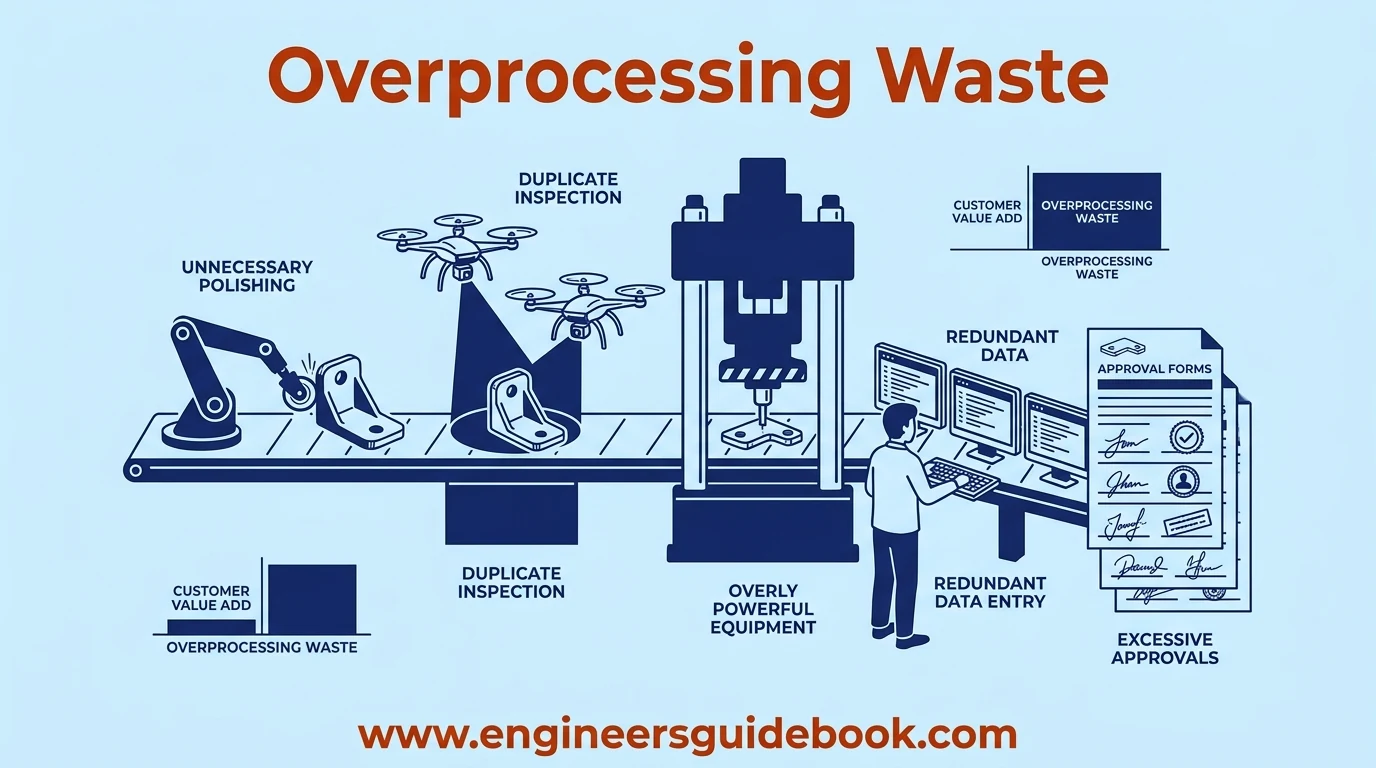
Overprocessing occurs when more work is performed than the customer or product specification actually requires.
It can involve redundant activities, excessive precision, duplicate inspections, unnecessary documentation, or overly sophisticated equipment.
The process may appear productive, yet additional effort does not increase customer value.
7.2 Unnecessary Process Steps
Processes often accumulate extra steps over time because old procedures remain after conditions change.
Products may be cleaned twice, data may be entered repeatedly, or components may undergo redundant handling.
Process mapping can expose these inherited activities and determine whether each step remains necessary.
7.3 Excessive Inspection
Inspection is important for quality assurance, but repeated inspection can become overprocessing when quality is not built into the process.
Instead of relying exclusively on downstream inspection, lean systems use standardized work, process controls, and mistake-proofing to prevent defects at their source.
7.4 Redundant Documentation
Duplicate forms, repeated signatures, multiple data-entry systems, and unnecessary reports consume administrative capacity.
Digitalization alone does not solve the problem if an inefficient process is simply transferred into software.
The underlying workflow should first be simplified.
7.5 Excessive Product Specifications
Products may be manufactured to tighter tolerances, superior finishes, or stronger materials than customers actually require.
Higher specifications are not automatically better.
When additional precision offers no functional or customer benefit, the extra machining, inspection, material, and processing cost becomes waste.
7.6 Inappropriate Equipment Selection
Using equipment that is unnecessarily large, complex, fast, or precise can create overprocessing.
A sophisticated CNC machine may be unnecessary for a basic operation that could be completed reliably with simpler equipment.
Equipment selection should match actual process requirements rather than technical capability alone.
7.7 Overprocessing Waste Examples
Examples include polishing a hidden surface beyond specification, entering identical information into several databases, performing duplicate inspections, or generating reports nobody uses.
Another example is requiring several management signatures for a routine low-risk purchase.
Each additional step should justify its contribution to quality, safety, compliance, or customer value.
7.8 Overprocessing Waste Reduction
Overprocessing can be reduced through process mapping, standardization, specification review, automation of justified repetitive work, simplified approvals, and elimination of duplicate activities.
Teams should repeatedly ask whether each process step changes the product, protects an essential requirement, or creates customer value.
When the answer is no, the activity deserves closer scrutiny.
8. Defects Waste
8.1 Defects Waste Definition
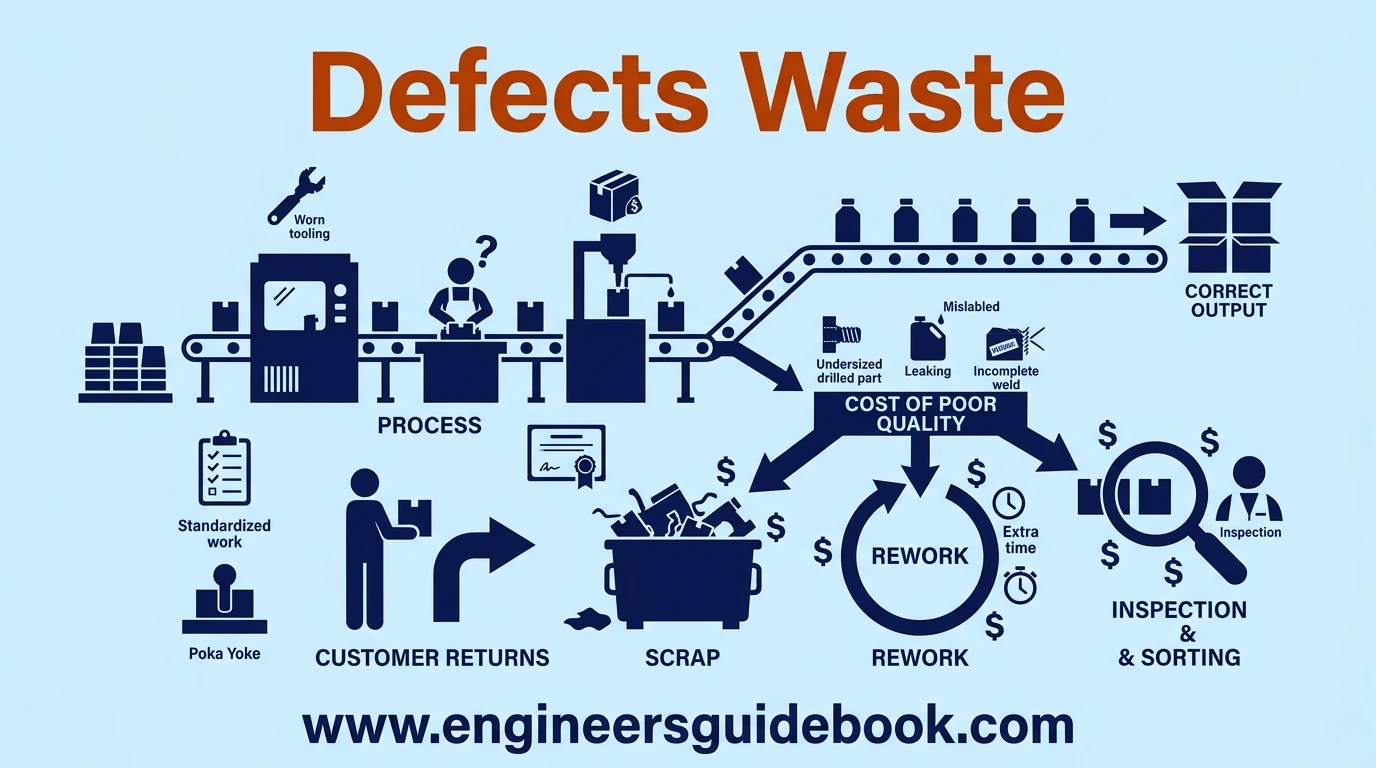
Defects waste occurs when a product, service, or process output fails to meet required specifications. The failure creates additional work through correction, replacement, inspection, or disposal. In lean manufacturing, defects are particularly costly because resources have already been consumed before the problem becomes visible.
8.2 Scrap and Rework
Scrap refers to material or products that cannot be economically recovered, while rework involves correcting defective output so it meets requirements. Both consume labor, machine time, energy, and materials. Rework can also disrupt schedules because production capacity is diverted from new customer demand toward fixing previous mistakes.
8.3 Customer Returns
Customer returns are one of the most expensive manifestations of defects. Beyond replacement or repair costs, returns create logistics expenses, administrative work, warranty claims, and reputational damage. Repeated failures can erode customer confidence and reduce future sales.
8.4 Inspection and Sorting
Inspection and sorting become waste when they are required primarily because the process cannot consistently produce acceptable output. Large inspection teams may detect problems, but they do not eliminate their causes. Lean systems therefore emphasize defect prevention rather than depending solely on downstream detection.
8.5 Common Causes of Defects
Defects may originate from incorrect machine settings, worn tooling, inadequate training, inconsistent raw materials, unclear work instructions, poor maintenance, or uncontrolled process variation. Human error is often blamed too quickly. In many cases, the real problem is a process that makes mistakes easy to commit.
8.6 Cost of Poor Quality
The cost of poor quality includes scrap, rework, returns, warranty claims, additional inspection, lost production time, customer complaints, and expedited shipments. Some consequences are less visible, such as damaged reputation and lost customer loyalty. Measuring these costs helps management understand the financial significance of quality improvement.
8.7 Defects Waste Examples
Examples include incorrect hole dimensions, leaking packages, mislabeled products, incomplete welds, damaged components, inaccurate invoices, and software errors. A filling line producing containers with incorrect fill volume is another practical example because defective units require segregation, investigation, adjustment, and possible reprocessing.
8.8 Defects Waste Reduction
Defects can be reduced through standardized work, process capability improvement, preventive maintenance, employee training, statistical process control, and Poka Yoke. Root causes should be eliminated rather than repeatedly correcting symptoms. Building quality into the process is generally more economical than inspecting quality into the product.
9. Skills Waste
9.1 Skills Waste Definition
Skills waste occurs when an employee’s knowledge, creativity, experience, and problem-solving capability are not fully utilized. It is sometimes called unused talent. Organizations lose valuable improvement opportunities when employees are treated only as task performers instead of knowledgeable contributors to process improvement.
9.2 Underutilized Employee Talent
Operators and technicians often understand recurring process problems better than distant decision-makers because they interact with equipment every day. Ignoring their observations can allow avoidable losses to continue. Lean organizations deliberately capture frontline knowledge through structured improvement activities.
9.3 Limited Employee Involvement
Employees who are excluded from decisions may become less engaged in improvement initiatives. Limited involvement also deprives management of practical information about real operating conditions. Daily meetings, suggestion systems, and Kaizen events can create channels through which employees influence process improvement.
9.4 Poor Task Assignment
Skills waste can occur when highly qualified employees spend excessive time performing routine administrative activities while important technical work remains unattended. Effective task allocation should match responsibility with capability while still providing opportunities for development.
9.5 Missing Improvement Opportunities
Minor inefficiencies often remain unresolved because employees believe improvement is solely management’s responsibility. Encouraging employees to report abnormalities and propose countermeasures transforms everyday experience into a continuous source of operational improvement.
9.6 Lack of Training and Development
Without training, employees may be unable to operate equipment efficiently, troubleshoot problems, or assume broader responsibilities. Cross-training, technical development, and structured competency programs increase workforce flexibility and reduce dependence on a small number of specialists.
9.7 Skills Waste Examples
Examples include ignoring an operator’s suggestion for reducing changeover time, assigning engineers to repetitive data entry, or preventing technicians from participating in root cause analysis. Each situation wastes capability that could otherwise improve performance.
9.8 Skills Waste Reduction
Organizations can reduce skills waste through employee involvement, cross-functional teams, recognition programs, Kaizen, structured training, and delegated problem-solving authority. People should be encouraged to identify waste and participate directly in eliminating it.

10. Waste Identification
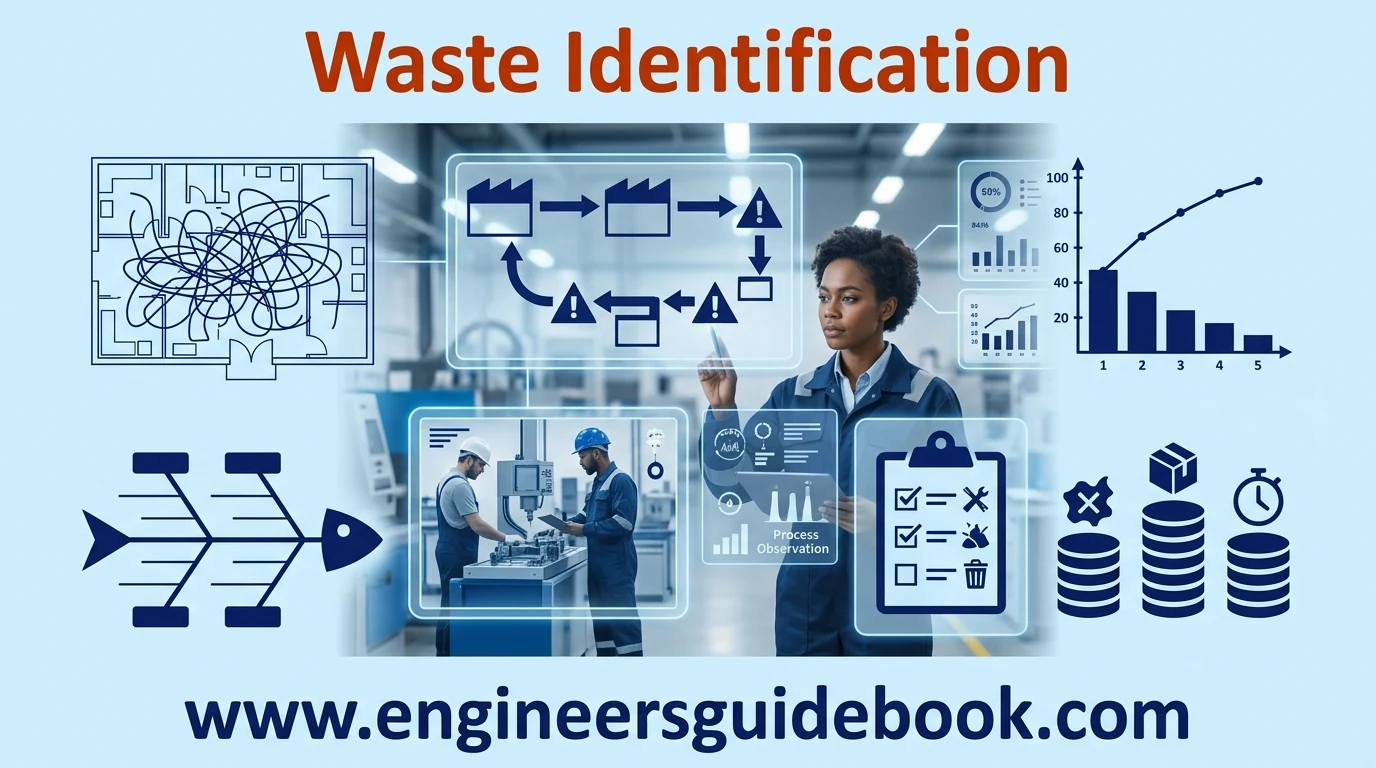
10.1 Gemba Walks
A Gemba walk involves visiting the actual workplace where value is created. Managers observe processes, speak with employees, and examine abnormalities directly. The objective is to understand reality rather than relying entirely on reports or assumptions.
10.2 Value Stream Mapping
Value Stream Mapping visualizes the flow of materials and information from supplier to customer. It highlights inventory accumulation, waiting time, excessive processing, and disconnected activities. A future-state map can then define a more streamlined flow.
10.3 Process Observation
Direct observation reveals small inefficiencies that reports often miss. Observers can record cycle times, delays, repeated movements, machine interruptions, and process variation. Repeated observation is especially useful because waste may not appear during a single production cycle.
10.4 Waste Walks
A waste walk focuses specifically on identifying examples of the eight wastes. Teams examine work areas for unnecessary movement, accumulated inventory, waiting, defects, and other losses. Photographs, notes, and measurements can support later analysis.
10.5 Spaghetti Diagrams
A spaghetti diagram traces the physical movement of people or materials through a workspace. Dense crossings and long travel routes usually indicate poor layout or unnecessary transportation. The diagram makes invisible movement patterns immediately comprehensible.
10.6 Pareto Analysis
Pareto analysis ranks problems according to frequency, cost, downtime, or another measurable impact. Teams can then concentrate on the few causes responsible for the largest share of losses instead of spreading resources across numerous minor issues.
10.7 Root Cause Analysis
Root Cause Analysis investigates why a problem occurs rather than merely correcting its immediate effect. Techniques such as the Five Whys and fishbone diagrams help distinguish fundamental causes from symptoms.
10.8 Lean Waste Audit Checklist
A lean waste audit checklist provides a structured method for examining transportation, inventory, motion, waiting, overproduction, overprocessing, defects, and skills waste. Regular audits also help track whether previous improvements remain effective.
10.9 Waste Prioritization
Not every waste should be addressed simultaneously. Prioritization should consider safety, customer impact, quality, cost, frequency, and implementation difficulty. High-impact problems with achievable countermeasures often provide the strongest starting point.
11. Waste Reduction Strategies
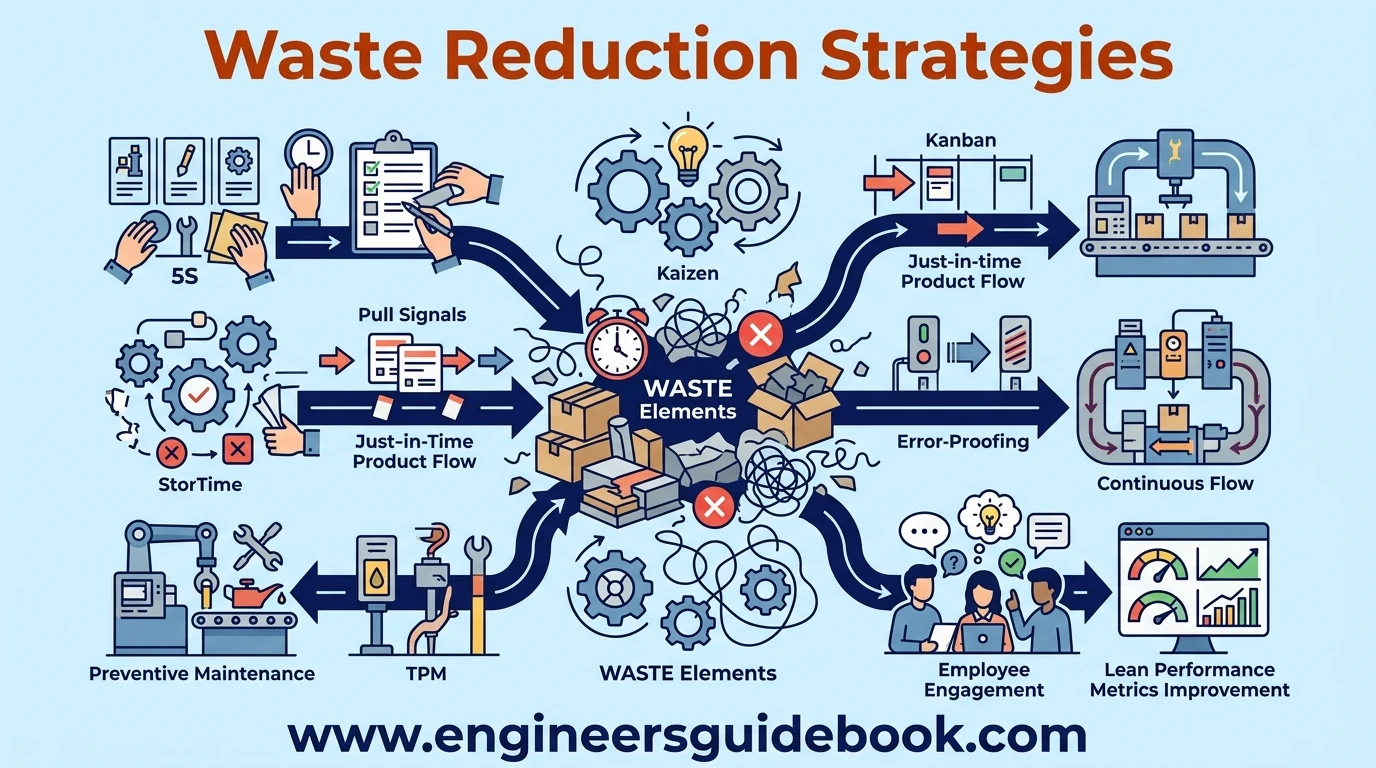
11.1 5S Workplace Organization
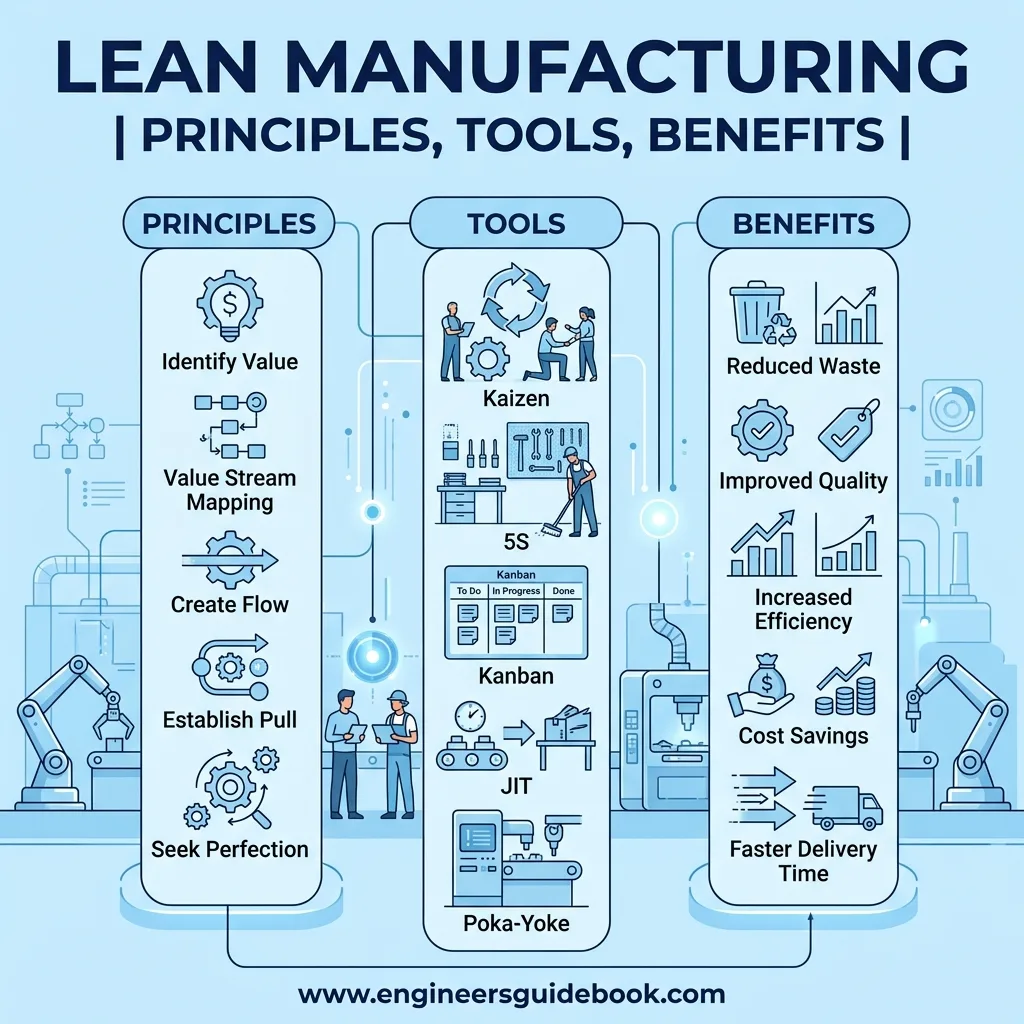
5S organizes the workplace through Sort, Set in Order, Shine, Standardize, and Sustain. It reduces searching, motion, clutter, and hidden abnormalities while creating a more disciplined operating environment.
11.2 Standard Work
Standard work defines the safest and most efficient known method for performing a task. It reduces variation and establishes a baseline from which future improvements can be evaluated.
11.3 Kaizen
Kaizen promotes continuous, incremental improvement involving employees at every level. Rather than waiting for major projects, teams repeatedly eliminate small inefficiencies that collectively influence performance.
11.4 Just in Time
Just in Time aims to provide the required item, in the required quantity, at the required time. It reduces inventory, overproduction, storage requirements, and excessive handling.
11.5 Kanban
Kanban uses visual signals to control replenishment according to actual consumption. It supports pull production and prevents upstream processes from producing unnecessarily.
11.6 Poka Yoke
Poka Yoke means mistake-proofing. Devices or process features are designed to prevent errors or immediately detect them before defective output progresses downstream.
11.7 Total Productive Maintenance
Total Productive Maintenance improves equipment reliability through preventive practices and operator involvement. Higher reliability reduces breakdowns, defects, waiting, and production instability.
11.8 Cellular Manufacturing
Cellular manufacturing positions equipment required for related processing steps within a compact production cell. This arrangement reduces transportation, motion, WIP, and lead time.
11.9 Continuous Flow
Continuous flow moves products from one operation to the next with minimal waiting or accumulation. Smaller batch sizes and balanced processes are essential for maintaining stable flow.
11.10 Employee Engagement
Employee engagement strengthens waste reduction because frontline personnel frequently recognize inefficiencies first. Organizations should provide mechanisms for suggestions, experimentation, and participation in improvement teams.
11.11 Lean Performance Metrics
Metrics such as cycle time, lead time, OEE, defect rate, WIP, changeover time, and first-pass yield reveal whether improvement efforts are producing measurable results. Metrics should support action rather than become reporting bureaucracy.
11.12 Continuous Improvement Culture
Lean becomes sustainable when waste elimination is embedded in daily behavior. Leaders must encourage experimentation, support problem-solving, recognize contributions, and resist returning to inefficient practices once immediate pressure subsides.
12. Frequently Asked Questions
12.1 What Are the 8 Wastes of Lean Manufacturing
The eight wastes are transportation, inventory, motion, waiting, overproduction, overprocessing, defects, and unused skills. They represent activities that consume resources without creating corresponding customer value.
12.2 What Does TIMWOODS Stand For in Lean Manufacturing
TIMWOODS stands for Transportation, Inventory, Motion, Waiting, Overproduction, Overprocessing, Defects, and Skills. It is a mnemonic used to remember the eight categories of lean waste.
12.3 What Is the Biggest Waste in Lean Manufacturing
Overproduction is often considered especially damaging because it generates additional inventory, transportation, storage, handling, and potential defects. However, the most significant waste varies between organizations and processes.
12.4 What Is the Difference Between Motion and Transportation Waste
Motion waste concerns unnecessary movement of people, while transportation waste involves unnecessary movement of materials, products, tools, or information between locations.
12.5 What Is an Example of Overproduction Waste
Producing 10,000 components when current customer demand requires only 6,000 is overproduction. The additional 4,000 units consume resources and require storage without creating immediate value.
12.6 How Can the Eight Wastes Be Identified
The wastes can be identified through Gemba walks, process observation, Value Stream Mapping, spaghetti diagrams, waste audits, employee feedback, and analysis of operational performance data.
12.7 How Can Lean Manufacturing Reduce Waste
Lean manufacturing reduces waste by improving process flow, establishing standard work, using pull systems, preventing defects, improving equipment reliability, organizing workplaces, and continuously solving root causes.
12.8 Why Is Unused Talent Considered a Lean Waste
Unused talent is waste because employee knowledge and creativity are organizational resources. When these capabilities are ignored, potential improvements, innovations, and problem-solving opportunities are lost.
12.9 What Is the Difference Between Muda Mura and Muri
Muda means waste, Mura means unevenness, and Muri means overburden. All three can interact, with uneven workloads creating overburden that eventually generates additional waste.
12.10 Can the Eight Wastes Apply Outside Manufacturing
Yes. The eight wastes can occur in healthcare, logistics, construction, software, retail, banking, offices, and service organizations wherever processes consume resources to deliver customer value.
13. Conclusion
The eight wastes provide a practical framework for recognizing activities that consume resources without creating sufficient value. Transportation, inventory, motion, waiting, overproduction, overprocessing, defects, and unused skills can exist simultaneously within one process.
Systematic waste reduction can decrease cost, shorten lead time, improve quality, increase equipment utilization, lower inventory, and strengthen customer responsiveness. It also makes processes more transparent and manageable.
Lean improvement should prioritize problems according to risk, customer impact, financial loss, and operational disruption. Teams should address root causes and verify that improvements deliver sustainable results rather than temporary corrections.