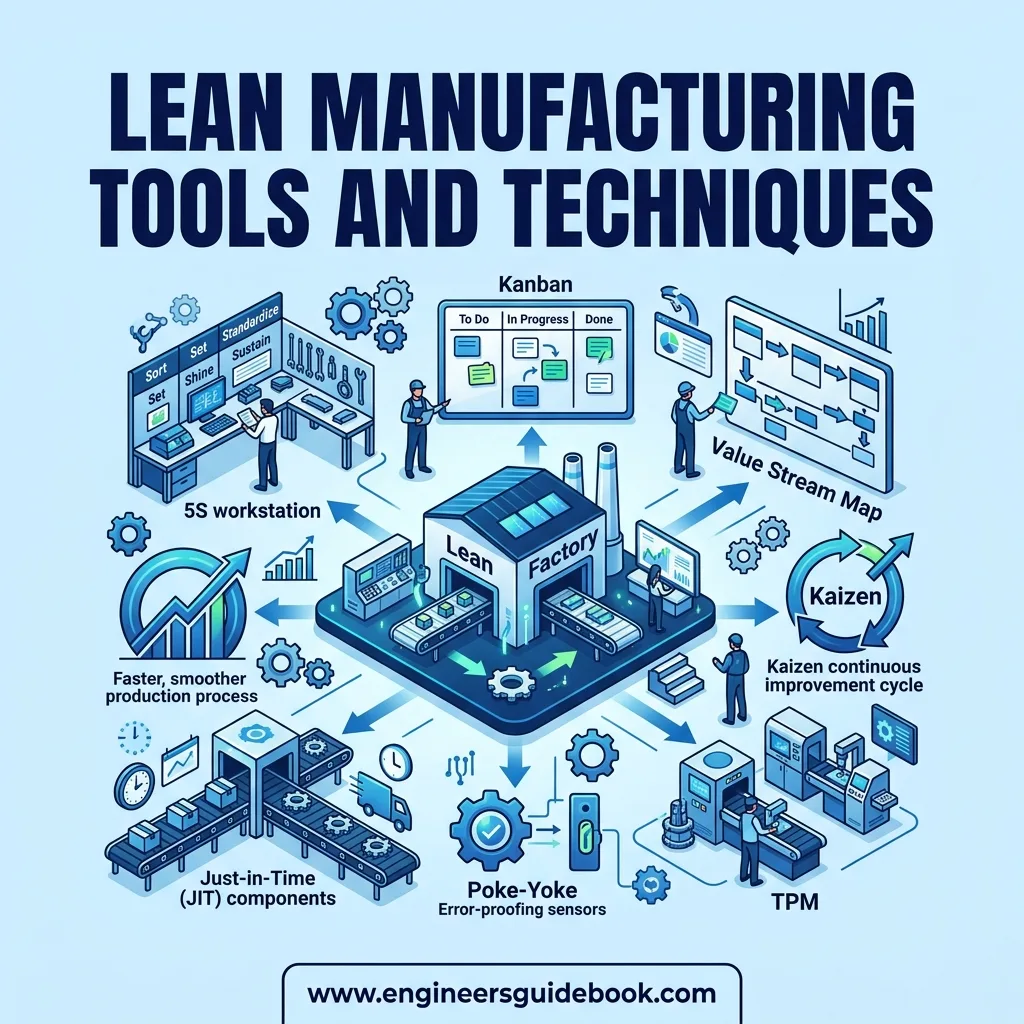
Lean manufacturing tools and techniques help organizations eliminate waste, improve quality, stabilize production, shorten lead times, and create greater customer value with fewer resources. Methods such as 5S, Kaizen, Kanban, value stream mapping, Jidoka, Poka Yoke, takt time, and Just in Time work together to expose inefficiencies and establish disciplined, continuously improving manufacturing systems.
1. Lean Manufacturing Tools Overview
1.1 Lean Manufacturing Tools
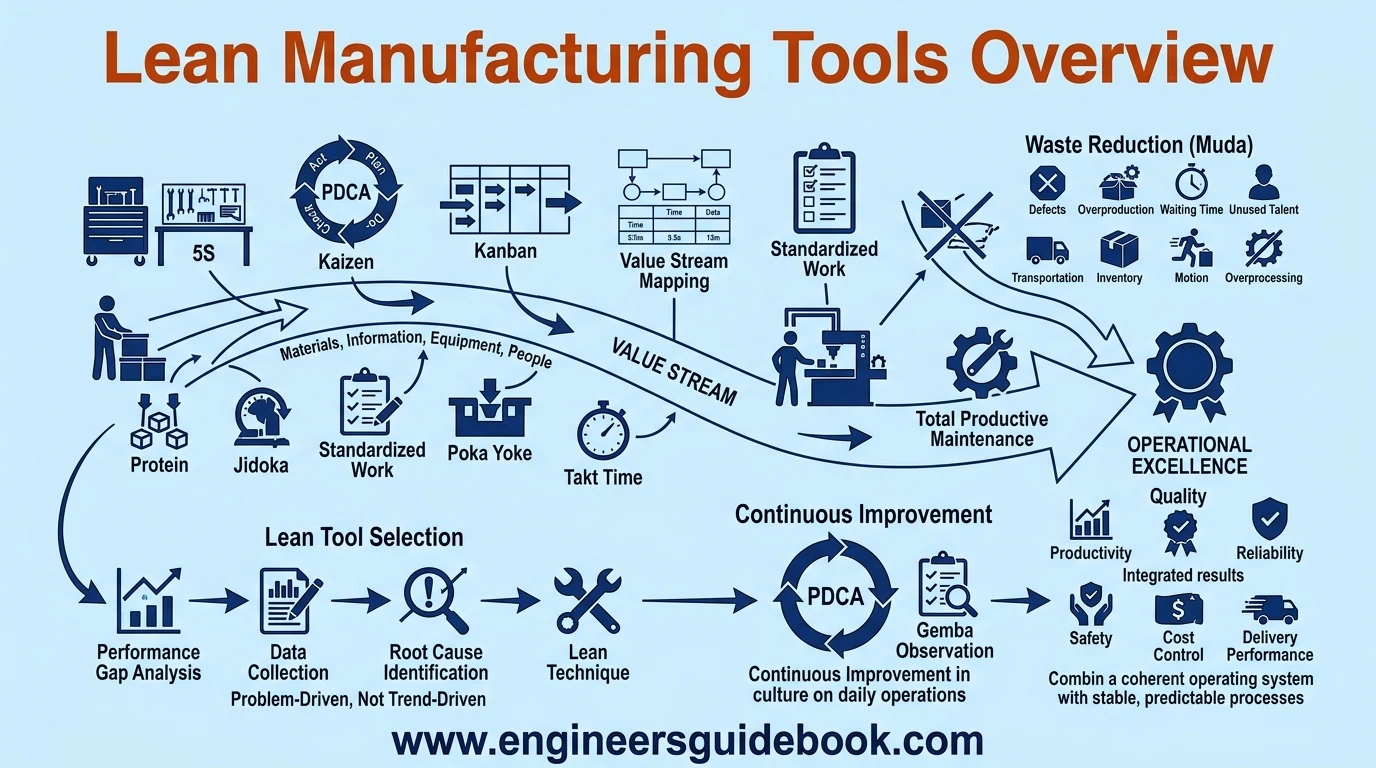
Lean manufacturing tools are structured methods used to improve production performance by removing non-value-added activities and strengthening process control. Rather than relying on isolated cost-cutting initiatives, lean tools examine how materials, information, equipment, and people move through an entire value stream.
Common tools include 5S, Kaizen, Kanban, value stream mapping, standardized work, Jidoka, Poka Yoke, takt time, and Total Productive Maintenance. Each addresses a different operational weakness, yet their collective purpose is the same: deliver customer value with minimum waste.
1.2 Lean Tools and Lean Principles
Lean tools are most effective when connected to fundamental lean principles. These principles include defining customer value, identifying the value stream, establishing smooth flow, introducing pull production, and pursuing continuous improvement.
A Kanban board, for example, is not inherently lean if it merely visualizes excessive inventory. Likewise, 5S becomes superficial when treated only as housekeeping. The underlying principle determines how the tool is applied. Organizations therefore achieve stronger results when techniques support an integrated lean management philosophy instead of becoming disconnected improvement exercises.
1.3 Waste Reduction
Waste reduction is central to lean manufacturing. Waste, often described through the Japanese term muda , consumes resources without increasing the value of the final product.
Typical manufacturing waste includes defects, overproduction, waiting, unused employee talent, transportation, excessive inventory, unnecessary motion, and overprocessing. Lean tools make these inefficiencies visible so they can be systematically reduced.
Removing waste can lower production costs, shorten cycle times, improve floor space utilization, and increase responsiveness without necessarily adding equipment or labor.
1.4 Continuous Improvement
Continuous improvement creates a culture in which processes are repeatedly examined and refined. Lean organizations do not consider today’s best method permanently optimal.
Small improvements can accumulate into substantial performance gains. Operators may reduce walking distance, engineers may eliminate recurring machine stoppages, and supervisors may redesign material replenishment.
Methods such as Kaizen, PDCA, and Gemba observation provide systematic mechanisms for discovering these opportunities. Improvement consequently becomes part of daily operations rather than an occasional management initiative.
1.5 Operational Excellence
Operational excellence represents the broader outcome of successful lean implementation. It combines productivity, quality, reliability, safety, cost control, and delivery performance into a coherent operating system.
Lean manufacturing supports this objective by making processes predictable and abnormalities conspicuous. Stable operations allow organizations to respond faster to customer requirements while reducing firefighting.
Operational excellence is therefore not simply maximum machine utilization. It is the ability to consistently produce the required quantity, at the required quality, when the customer needs it.
1.6 Lean Tool Selection
Selecting the correct lean tool begins with understanding the problem. Introducing Kanban to a process suffering from chronic machine breakdowns may accomplish little, while implementing 5S alone cannot resolve structural production bottlenecks.
Organizations should first identify the performance gap, collect relevant data, determine its root causes, and then choose the technique capable of addressing those causes.
Tool selection should be problem-driven rather than trend-driven. A narrowly targeted method often produces better results than deploying numerous lean techniques simultaneously without clear objectives.
2. Workplace Organization Tools
2.1 5S
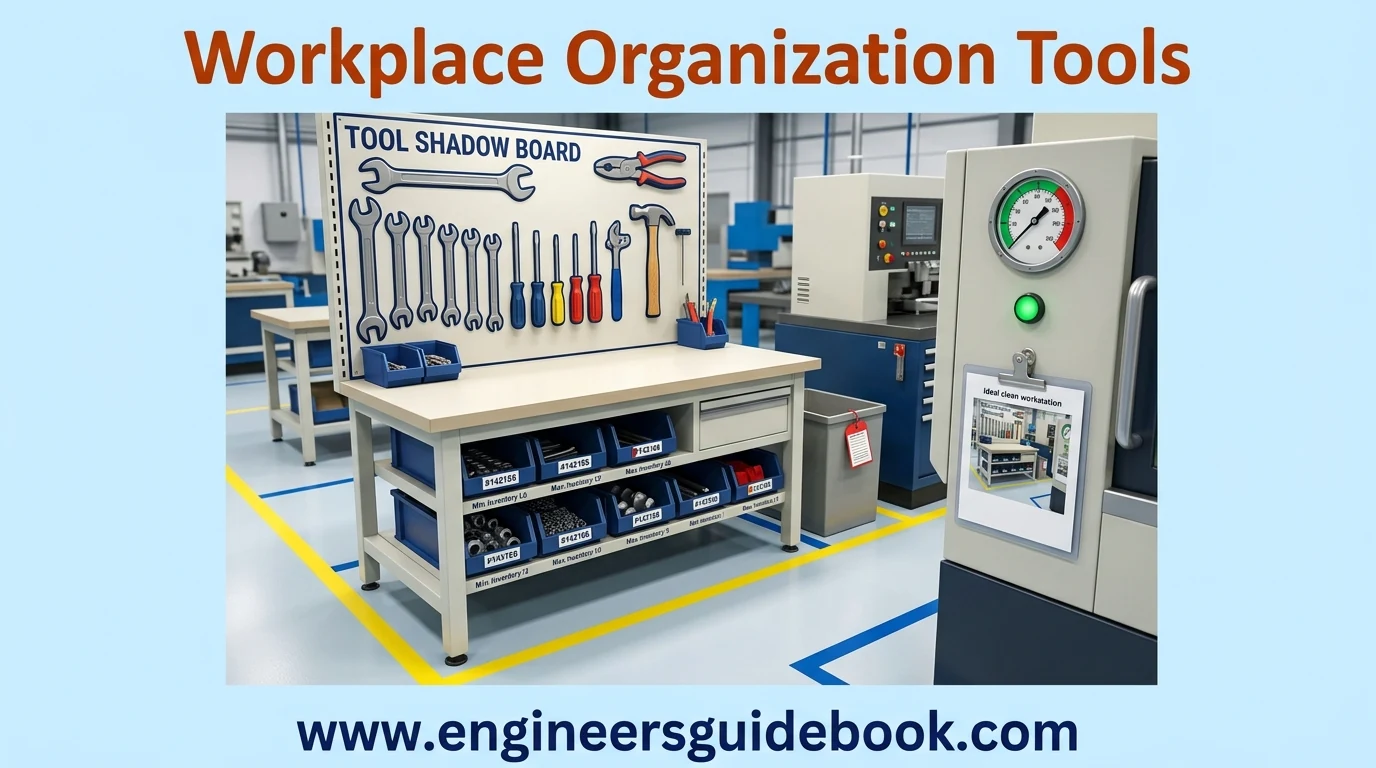
5S is a workplace organization methodology designed to establish orderly, efficient, and visually controlled work areas. The five stages are Sort, Set in Order, Shine, Standardize, and Sustain.
The method reduces wasted motion, searching, clutter, contamination, and unsafe conditions. More importantly, 5S creates the foundational discipline required for advanced lean practices by making abnormal workplace conditions easier to detect.
2.2 Sort
Sort involves separating necessary items from unnecessary ones. Obsolete tools, damaged components, unused fixtures, redundant paperwork, and surplus materials are removed from the workplace.
A red-tagging system is frequently used to identify questionable items before disposition. The objective is not indiscriminate disposal but elimination of clutter that obstructs movement, consumes space, and conceals abnormalities.
2.3 Set in Order
Set in Order establishes designated locations for tools, components, documents, and equipment. Frequently used items should be positioned where workers can access them with minimal movement.
Shadow boards, labeled storage locations, floor markings, and point-of-use storage can improve accessibility. A well-arranged workplace reduces retrieval time and makes missing items immediately apparent.
2.4 Shine
Shine focuses on cleaning the workplace while simultaneously inspecting equipment and working conditions. Cleaning can reveal oil leakage, loose fasteners, cracks, abnormal wear, damaged guards, or other developing defects.
For this reason, Shine extends beyond cosmetic cleanliness. It converts routine cleaning into an elementary inspection activity that supports equipment reliability and workplace safety.
2.5 Standardize
Standardize converts successful 5S practices into repeatable routines. Visual standards, cleaning schedules, checklists, photographs, inspection criteria, and assigned responsibilities help maintain consistent workplace conditions.
Without standardization, improvements frequently deteriorate after the initial implementation campaign. Clear standards establish an observable baseline against which deviations can be identified.
2.6 Sustain
Sustain ensures that 5S becomes habitual rather than temporary. Regular audits, leadership involvement, employee ownership, coaching, and corrective actions reinforce expected behaviors.
Sustain is frequently the most difficult stage because it requires behavioral consistency. Organizations that embed 5S into routine management systems are more likely to preserve improvements over the long term.
2.7 Visual Management
Visual management communicates operational information in a form that can be understood quickly. Production boards, status indicators, floor markings, performance charts, labels, and equipment identification systems allow employees to recognize conditions without searching through complicated records.
Effective visual management makes the workplace self-explanatory and supports faster decisions.
2.8 Visual Controls
Visual controls go beyond displaying information by indicating whether a process is operating within defined conditions. Color-coded gauges, minimum and maximum inventory lines, Andon lights, tool outlines, and marked storage zones are common examples.
Good visual controls make deviations conspicuous. Employees can therefore respond to problems before those problems propagate through downstream operations.
2.9 Workplace Standards
Workplace standards define how tasks, materials, equipment, and work areas should be maintained. They establish consistency between shifts and operators.
Standards may specify tool locations, cleaning responsibilities, inspection frequencies, work sequences, or material limits. Stable workplace standards provide the baseline from which subsequent improvements can be measured.
3. Continuous Improvement Tools
3.1 Kaizen
Kaizen means continuous improvement through frequent, incremental changes. Instead of depending exclusively on expensive technological breakthroughs, Kaizen encourages employees to improve everyday processes using practical observations and experimentation.
The approach values participation because frontline employees often understand process difficulties that remain invisible in management reports.
3.2 Kaizen Events
Kaizen events are focused improvement activities conducted over a concentrated period. Cross-functional teams investigate a defined problem, study the existing process, implement changes, and evaluate results.
They are particularly useful for setup reduction, layout improvement, workflow redesign, and recurring production losses. Successful events should produce measurable improvements rather than recommendations alone.
3.3 PDCA
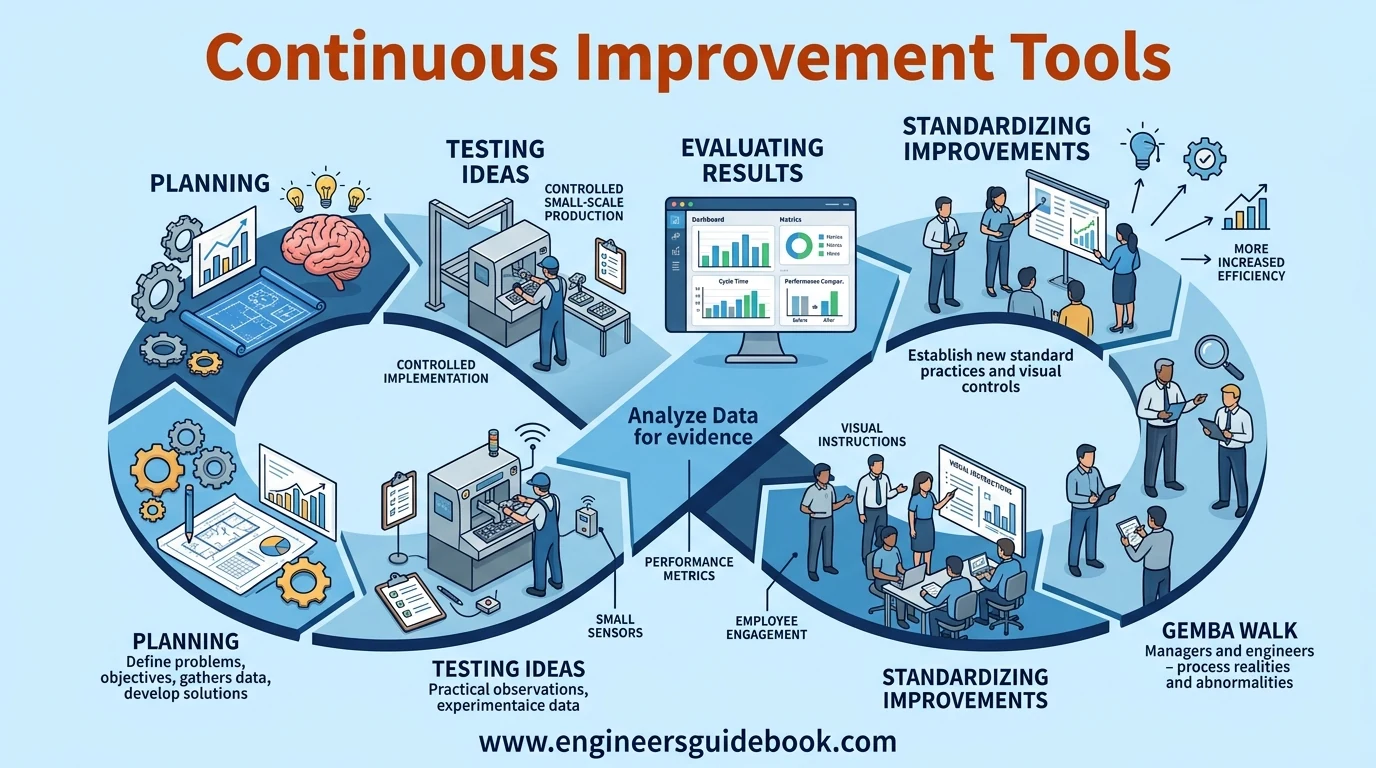
PDCA stands for Plan, Do, Check, and Act. It provides a systematic cycle for testing improvement ideas while reducing the risk of implementing unsupported assumptions.
Instead of making permanent changes immediately, teams develop a hypothesis, test it, evaluate the evidence, and standardize the improvement when successful.
3.4 Plan
The Plan stage defines the problem, establishes objectives, gathers data, analyzes causes, and develops a proposed solution.
A strong plan describes both the expected improvement and the measurement method. This creates a clear basis for determining whether the proposed change actually works.
3.5 Do
During the Do stage, the proposed solution is implemented, preferably on a controlled scale. Teams observe the process and collect relevant performance data.
Pilot implementation limits exposure while providing practical evidence regarding whether the proposed solution is feasible under real operating conditions.
3.6 Check
Check compares actual results with the objectives established during planning. Teams analyze data to determine whether the change improved performance and whether any unintended consequences occurred.
Evidence is essential. A solution that appears successful subjectively may produce negligible improvement when cycle time, defects, downtime, or cost are measured objectively.
3.7 Act
Act converts validated improvements into the new standard. Procedures, training documents, visual instructions, maintenance routines, and operating parameters may require revision.
When the experiment fails, lessons are incorporated into another PDCA cycle. Continuous learning therefore becomes embedded within the improvement process.
3.8 Gemba Walk
A Gemba Walk involves visiting the actual place where work occurs. Managers, engineers, and improvement teams observe operations directly instead of depending exclusively on reports or assumptions.
The objective is to understand process reality, engage employees, identify abnormalities, and ask constructive questions about barriers to effective work.
3.9 Gemba Observation
Gemba observation requires disciplined attention to material movement, waiting, operator motion, equipment behavior, work sequence, inventory accumulation, and information flow.
Observers should distinguish symptoms from underlying causes. Effective observation converts the production floor into a source of empirical evidence for improvement.
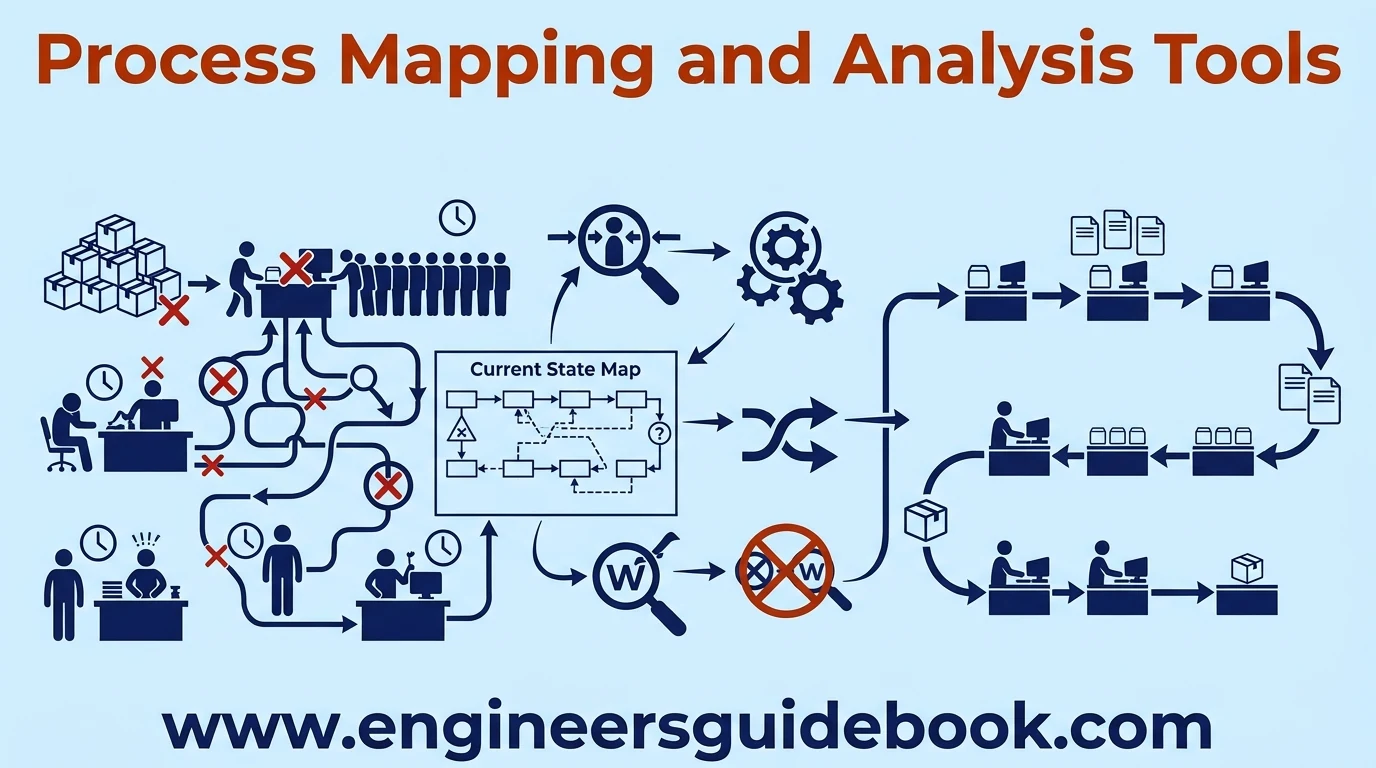
4. Process Mapping and Analysis Tools
4.1 Value Stream Mapping
Value Stream Mapping visually represents the movement of materials and information required to deliver a product. It typically records process steps, cycle times, inventories, waiting periods, information signals, and production flow.
The resulting map helps teams see system-wide waste that might remain hidden when departments are analyzed independently.
4.2 Current State Mapping
Current state mapping documents how the process operates today. Actual production data should be collected from the workplace rather than constructed from idealized procedures.
The map exposes delays, excessive inventory, disconnected processes, information gaps, and other impediments that influence total lead time.
4.3 Future State Mapping
Future state mapping illustrates how the value stream should operate after identified waste is reduced. It may introduce pull systems, continuous flow, smaller batches, improved information signals, or balanced workloads.
The future state provides a practical destination for improvement rather than an abstract declaration that efficiency should increase.
4.4 Bottleneck Analysis
Bottleneck analysis identifies the process step that restricts overall system throughput. Increasing output elsewhere may simply create additional inventory ahead of the constraint.
Lean teams therefore examine capacity, cycle time, downtime, changeovers, and demand to locate the true restriction before directing improvement resources.
4.5 Constraint Identification
Constraint identification determines what prevents a process from achieving its required performance. Constraints may involve equipment, labor, materials, approvals, floor space, scheduling, or technical capability.
Accurately identifying the governing constraint prevents organizations from optimizing activities that have little effect on total system output.
4.6 Process Flow Analysis
Process flow analysis examines how products, people, information, and materials move through operations. Excessive travel, backtracking, queues, handoffs, and interruptions usually indicate opportunities for improvement.
Flow analysis can support layout redesign, reduced handling, shorter lead time, and clearer production sequencing.
4.7 Waste Identification
Waste identification applies lean thinking directly to observed processes. Teams examine each activity and determine whether it creates customer value, supports necessary operations, or represents removable waste.
The objective is not simply to make individual tasks faster. It is to challenge whether non-value-added work should exist at all.
5. Production Flow Tools
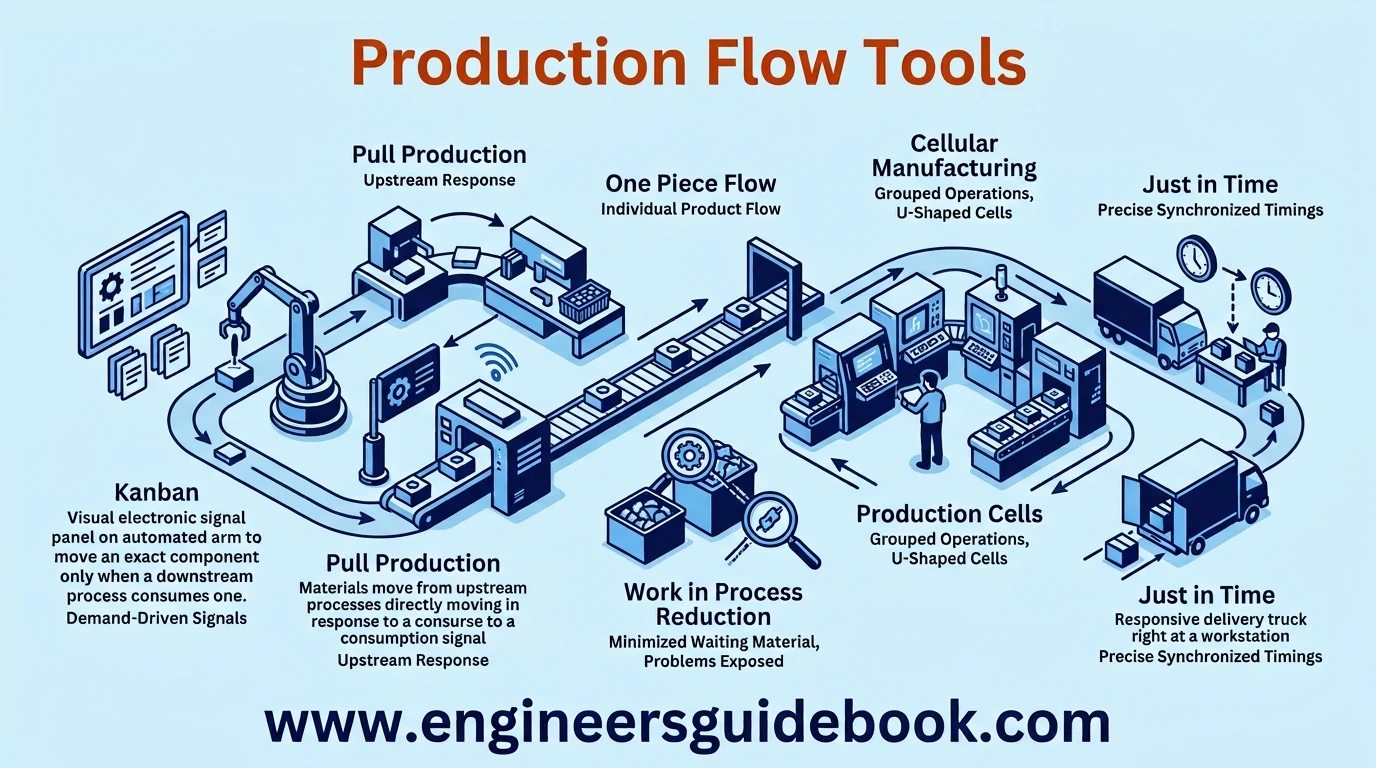
5.1 Kanban
Kanban is a visual signaling method used to control production and material replenishment. Cards, bins, electronic signals, or designated spaces authorize movement or production based on actual consumption.
By limiting work in process, Kanban exposes shortages, delays, and instability while discouraging uncontrolled overproduction.
5.2 Pull Production
Pull production begins work in response to downstream demand instead of producing according to speculative forecasts alone.
When one process consumes material, a replenishment signal triggers the upstream process. This reduces unnecessary inventory and aligns production more closely with actual requirements.
5.3 Just in Time
Just in Time aims to provide the correct item, in the required quantity, at the required location, when it is needed.
Successful JIT depends on reliable equipment, stable processes, responsive suppliers, disciplined scheduling, and consistent quality. Without these foundations, reducing inventory too aggressively can expose operations to severe disruption.
5.4 One Piece Flow
One Piece Flow moves products through sequential operations individually rather than processing large batches.
This approach can shorten lead times, reduce intermediate inventory, reveal defects sooner, and accelerate feedback. It works best where process times are sufficiently balanced and equipment reliability is high.
5.5 Cellular Manufacturing
Cellular manufacturing arranges equipment according to the processing sequence required for a product family. Machines that were previously distributed across separate departments can be positioned together to create streamlined flow.
Cells reduce transportation, waiting, and work in process while improving communication between operators.
5.6 Production Cells
Production cells are compact work arrangements designed around a defined sequence of operations. U-shaped layouts are frequently used because operators can access multiple processes with limited movement.
Effective cells support flexible staffing, rapid material flow, visual supervision, and improved response to changing demand.
5.7 Work in Process Reduction
Work in process reduction minimizes material waiting between production stages. High WIP consumes space and capital while frequently concealing equipment instability, quality problems, and process imbalance.
Lower inventory makes operational weaknesses more visible and encourages teams to resolve their underlying causes.
5.8 Continuous Flow
Continuous flow aims to move products through processes without unnecessary stopping, batching, or queueing.
Achieving smooth flow requires balanced cycle times, reliable equipment, consistent quality, standardized work, and effective material replenishment. When established correctly, continuous flow dramatically compresses manufacturing lead time.
6. Production Planning Tools
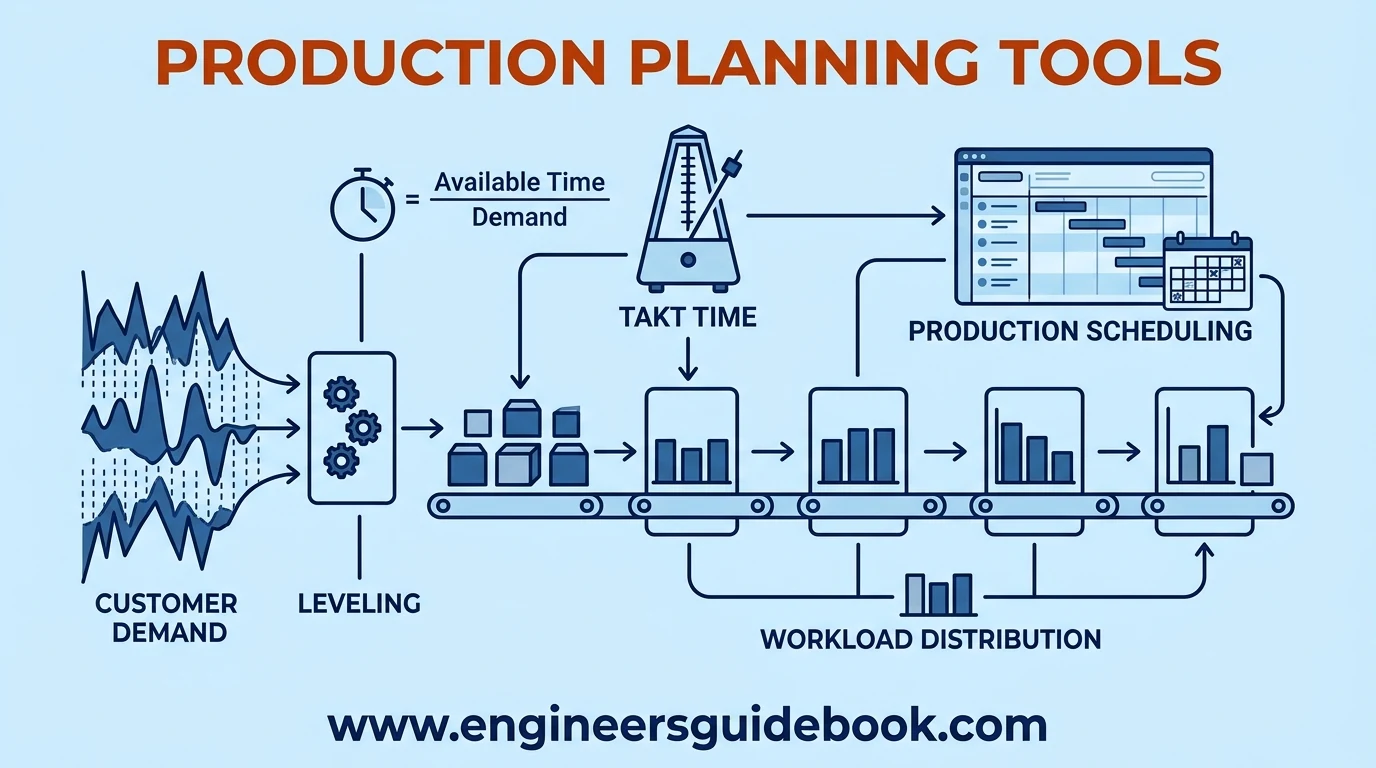
6.1 Heijunka
Heijunka is the practice of leveling production volume and product mix over time. Instead of producing large batches according to volatile demand patterns, organizations distribute work more evenly.
Leveling reduces abrupt workload fluctuations and supports predictable utilization of people, equipment, and suppliers.
6.2 Production Leveling
Production leveling stabilizes operations by smoothing workload across available production periods. Large peaks followed by idle periods create inefficiency and can amplify overtime, inventory, and scheduling problems.
A leveled schedule creates a steadier production rhythm and strengthens downstream flow.
6.3 Takt Time
Takt time represents the production pace required to satisfy customer demand. It is calculated by dividing available production time by customer demand for the same period.
Comparing process cycle time with takt time allows managers to determine whether a workstation can meet required output.
6.4 Customer Demand Rate
Customer demand rate establishes how frequently finished products must be completed. It provides the commercial reference point for designing production capacity.
Lean manufacturing seeks to synchronize operations with this demand rather than maximizing isolated machine output regardless of actual requirements.
6.5 Capacity Balancing
Capacity balancing aligns process capability with required production rates. When one workstation operates substantially slower than adjacent steps, queues and waiting develop.
Redistributing tasks, improving methods, changing staffing, or removing losses can bring workloads closer to takt time and improve flow stability.
6.6 Workload Distribution
Workload distribution allocates tasks among operators and machines so work is performed efficiently without creating persistent overburden or idle capacity.
Tools such as standardized work combination tables and Yamazumi charts can help visualize imbalances and support more equitable task allocation.
6.7 Production Scheduling
Lean production scheduling coordinates what should be produced, when it should be produced, and in what quantity. Effective schedules consider demand, capacity, changeovers, material availability, and process stability.
The goal is predictable flow with minimal inventory rather than constant rescheduling and emergency expediting.
7. Quality Improvement Tools
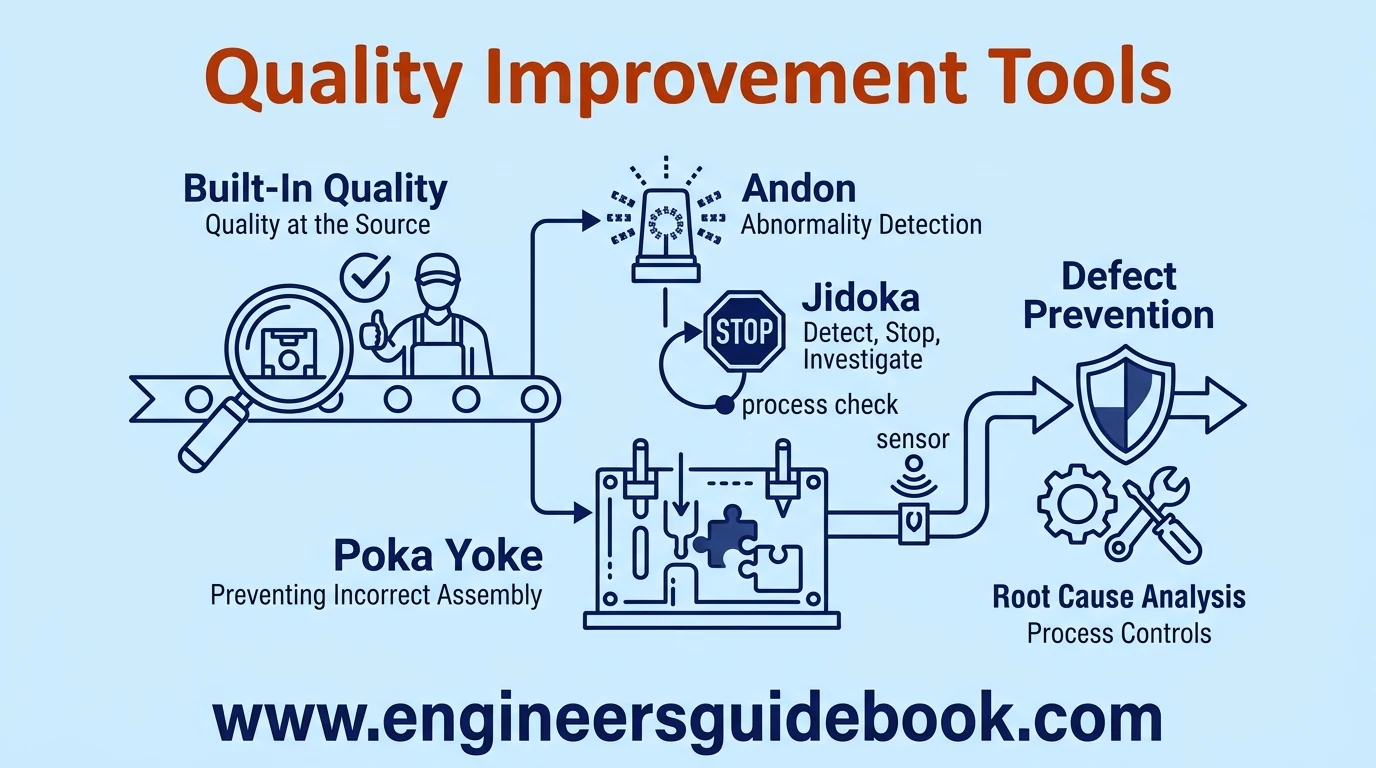
7.1 Jidoka
Jidoka means building the ability to detect abnormal conditions and stop production when necessary. Rather than allowing defects to continue downstream, the process creates an immediate opportunity for investigation.
This principle combines automation with human judgment and prevents defective output from multiplying unnoticed.
7.2 Built In Quality
Built In Quality requires each process to produce acceptable output before transferring work downstream. Quality is therefore created during production rather than inspected into the product afterward.
Operators are empowered to identify abnormalities, correct problems, and prevent recurrence at their source.
7.3 Poka Yoke
Poka Yoke refers to mistake-proofing techniques that prevent errors or make them immediately detectable. Fixtures, sensors, connectors, guides, counters, and interlocks can all serve as Poka Yoke devices.
Simple solutions are often highly effective because they remove dependence on memory or constant vigilance.
7.4 Mistake Proofing
Mistake proofing redesigns tasks so incorrect actions become impossible, difficult, or immediately obvious.
For example, asymmetrical components can prevent incorrect assembly orientation, while sensors can verify component presence before a machine cycle begins. Prevention is generally more economical than detecting defects after production.
7.5 Andon
Andon is a visual or audible system used to communicate abnormal conditions. Lights, displays, alarms, or digital dashboards can indicate equipment faults, quality problems, shortages, or requests for assistance.
Rapid visibility shortens response time and supports immediate problem containment.
7.6 Abnormality Detection
Abnormality detection enables organizations to distinguish normal operating conditions from deviations quickly. Sensors, control limits, standard conditions, alarms, visual indicators, and operator inspections can all support detection.
The earlier an abnormality is identified, the lower the probability that it develops into widespread defects, downtime, or safety risk.
7.7 Quality at the Source
Quality at the Source assigns responsibility for quality to the process where the work is performed. Operators verify critical conditions and correct problems before transferring output to the next operation.
This approach reduces dependence on final inspection and accelerates feedback about emerging process problems.
7.8 Defect Prevention
Defect prevention focuses on eliminating the mechanisms that generate nonconforming products. Root cause analysis, standardized work, process controls, Poka Yoke, preventive maintenance, and employee training can all contribute.
The lean objective is not merely to detect defective products efficiently. It is to design and control processes so defects are progressively less likely to occur.
8. Standardization and Problem Solving Tools
8.1 Standard Work
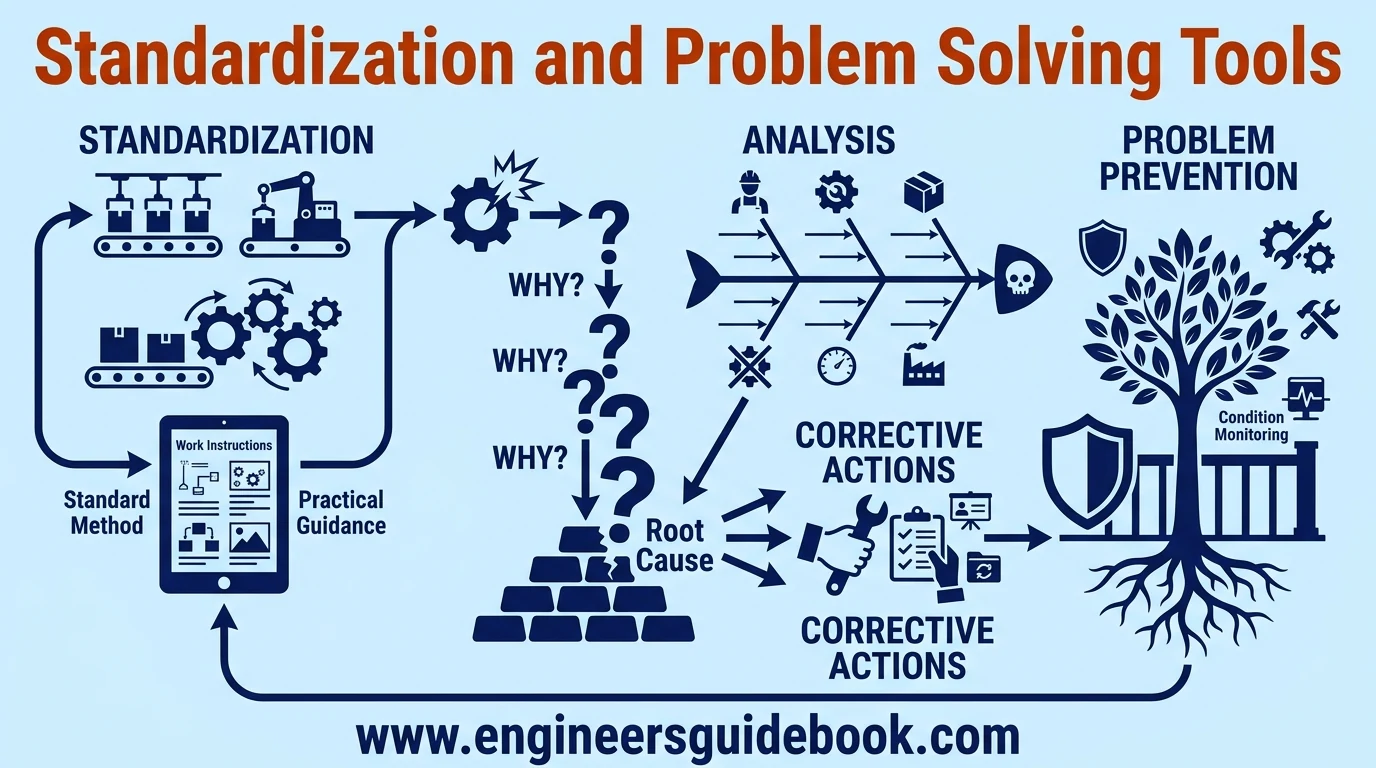
Standard Work defines the safest, most efficient, and repeatable method for completing a task under current operating conditions. It normally specifies work sequence, takt alignment, standard inventory, and expected cycle time. By reducing variation between operators and shifts, Standard Work creates process stability while establishing a measurable baseline for future improvement.
8.2 Standard Work Instructions
Standard Work Instructions translate process standards into practical guidance for employees. They may include task sequences, photographs, diagrams, quality checkpoints, safety precautions, and operating parameters.
Effective instructions should be clear, accessible, and periodically revised. When improvements are proven, the new method becomes the updated standard rather than remaining informal knowledge possessed by only a few experienced workers.
8.3 A3 Problem Solving
A3 Problem Solving is a structured methodology that condenses a problem, analysis, countermeasures, and follow-up plan onto a concise document. It encourages logical thinking rather than superficial troubleshooting.
A typical A3 includes the problem background, current condition, target condition, root cause analysis, proposed actions, implementation responsibilities, and verification. Its real value lies in disciplined reasoning and communication.
8.4 5 Whys
The 5 Whys technique investigates a problem by repeatedly asking why it occurred until the underlying cause becomes apparent.
For example, a machine may stop because a bearing failed. The bearing failed because lubrication was inadequate. Lubrication was inadequate because the lubrication interval was not defined correctly. The technique prevents teams from treating symptoms as causes and encourages deeper investigation.
8.5 Fishbone Diagram
A Fishbone Diagram, also called an Ishikawa or cause-and-effect diagram, organizes potential causes of a problem into logical categories. Common categories include manpower, machine, material, method, measurement, and environment.
The tool is particularly useful during cross-functional brainstorming because it prevents teams from focusing prematurely on one suspected cause. Potential causes can then be verified through data and observation.
8.6 Root Cause Analysis
Root Cause Analysis identifies the fundamental mechanism responsible for a recurring failure or performance gap. Methods can include 5 Whys, Fishbone Diagrams, fault trees, Pareto analysis, and process data evaluation.
A strong RCA distinguishes causal evidence from assumption. Eliminating the root cause should reduce the probability of recurrence rather than simply restore production temporarily.
8.7 Corrective Actions
Corrective actions remove verified causes of existing problems. Examples include redesigning a component, changing a maintenance interval, modifying a work method, improving operator training, or introducing an engineering control.
Actions should have responsible owners, deadlines, verification criteria, and follow-up reviews. Completion alone is insufficient; effectiveness must also be confirmed.
8.8 Problem Prevention
Problem prevention shifts attention from repairing failures to designing processes that resist failure. Preventive maintenance, standardized work, mistake-proofing, condition monitoring, training, and process capability improvement all contribute.
The strongest lean systems continuously convert lessons from previous abnormalities into controls that prevent similar problems from reappearing.
9. Equipment and Efficiency Tools
9.1 Total Productive Maintenance
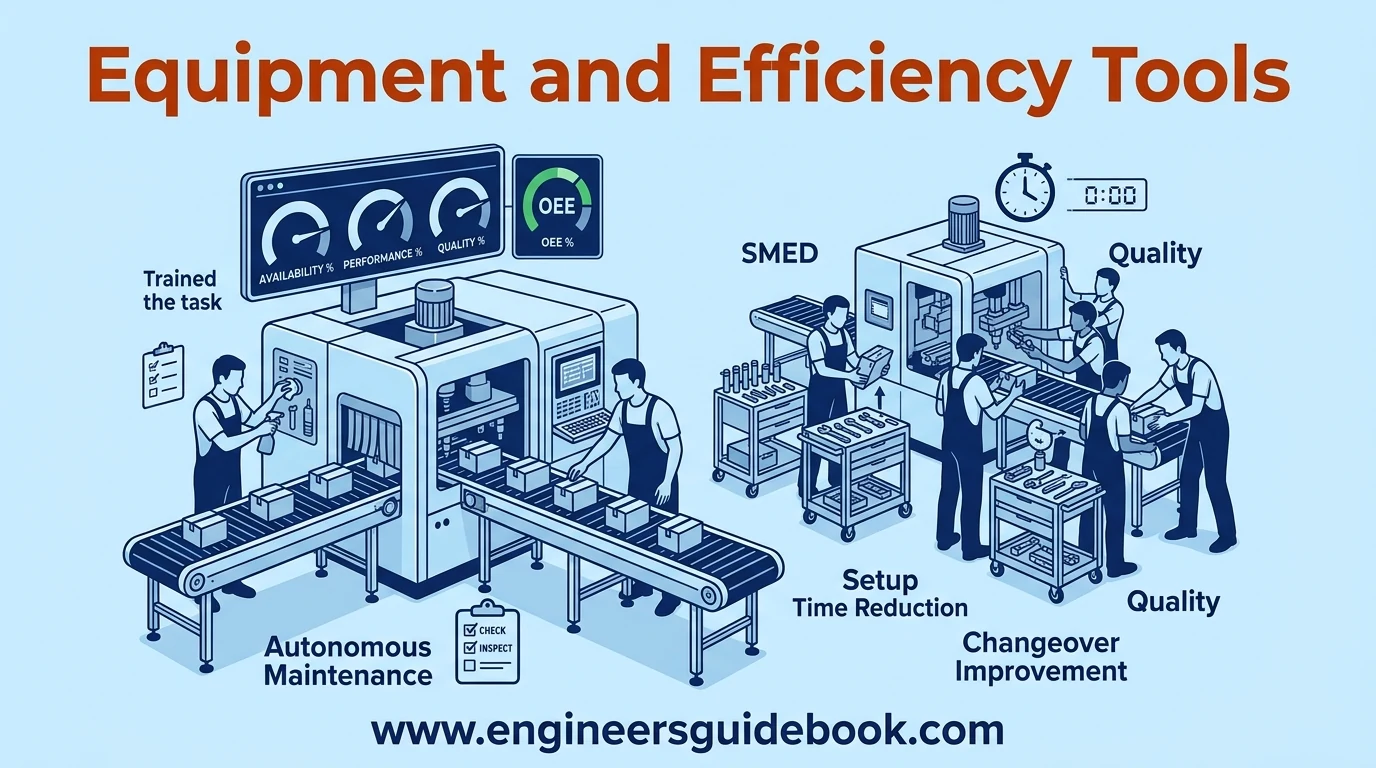
Total Productive Maintenance, or TPM, improves equipment effectiveness by involving production, maintenance, engineering, and management in equipment reliability.
TPM emphasizes proactive maintenance, operator ownership, defect elimination, and continuous improvement. Rather than viewing breakdowns as inevitable, organizations systematically reduce the conditions that create them.
9.2 Autonomous Maintenance
Autonomous Maintenance assigns routine equipment care to trained operators. Typical activities include cleaning, lubrication, inspection, tightening, and identifying abnormalities.
Operators become the first line of equipment health monitoring, while maintenance specialists focus on more complex technical work. The result can be faster defect detection and stronger ownership of machine condition.
9.3 Planned Maintenance
Planned Maintenance schedules maintenance activities according to equipment criticality, failure history, condition, or manufacturer recommendations.
Preventive and predictive strategies reduce dependence on emergency repairs. Maintenance planning also improves labor allocation, spare parts preparation, shutdown coordination, and equipment availability.
9.4 Overall Equipment Effectiveness
Overall Equipment Effectiveness, or OEE, measures how effectively equipment converts scheduled production time into good output. It combines availability, performance, and quality.
A high OEE requires more than low downtime. Machines must also run near expected speed and produce conforming products. OEE therefore exposes multiple forms of hidden production loss.
9.5 Availability
Availability measures the proportion of planned production time during which equipment is capable of operating.
Breakdowns, lengthy adjustments, and unplanned stoppages reduce availability. Improving preventive maintenance, spare parts management, troubleshooting, and reliability engineering can increase this component of OEE.
9.6 Performance
Performance compares actual operating speed with the theoretical or established ideal production rate.
Minor stops, reduced machine speed, inefficient feeding, and operator delays can lower performance even when the equipment remains technically available. Tracking these losses helps reveal inefficiencies that conventional downtime reports may overlook.
9.7 Quality
The quality component of OEE represents the percentage of produced units that meet specifications without requiring rework or rejection.
Startup scrap, process instability, equipment wear, incorrect settings, and material variation can reduce quality performance. Lean organizations attack these losses at their source.
9.8 SMED
Single-Minute Exchange of Die, or SMED, is a methodology for reducing setup and changeover time. The approach separates activities that require equipment stoppage from those that can be completed while the machine continues operating.
Internal activities are then simplified, standardized, or converted into external activities wherever practical.
9.9 Setup Time Reduction
Setup time reduction improves flexibility by decreasing the time required to prepare equipment for another product or process.
Pre-staging tools, using quick-release mechanisms, standardizing adjustments, improving fixture design, and organizing setup activities can significantly shorten downtime. Faster setups also make smaller production batches economically feasible.
9.10 Changeover Improvement
Changeover improvement examines the entire transition between products, including cleaning, tooling, parameter adjustment, verification, and startup.
Video analysis and direct observation can reveal wasted motion and sequential tasks that could be performed simultaneously. Consistent changeovers improve scheduling flexibility and reduce production losses.
10. Strategic Improvement Tools
10.1 Hoshin Kanri
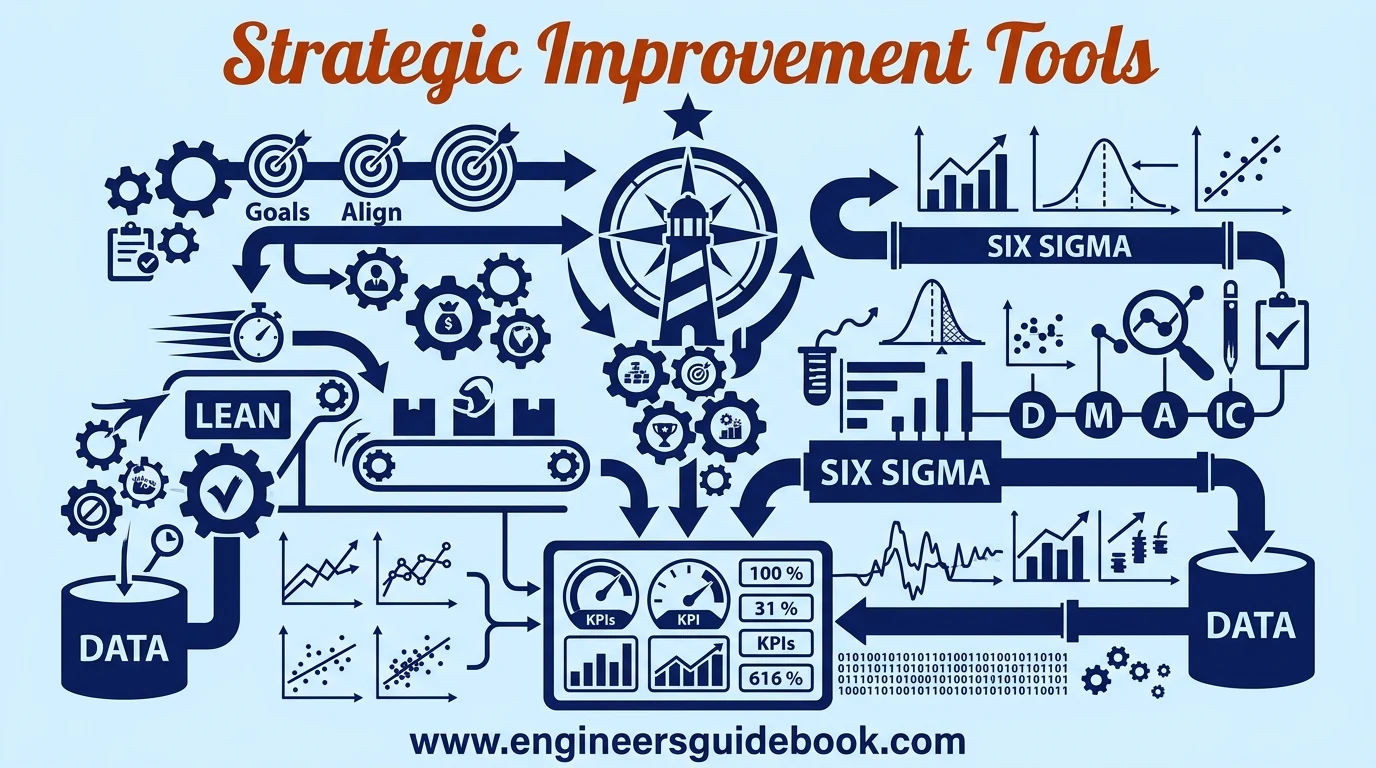
Hoshin Kanri is a strategic deployment method used to align improvement activities with organizational priorities. It translates long-term objectives into measurable annual goals and operational initiatives.
This prevents lean efforts from becoming isolated projects without strategic relevance.
10.2 Policy Deployment
Policy Deployment converts executive priorities into coordinated objectives across departments and management levels.
Goals, responsibilities, measures, and improvement activities are connected so teams understand how their work contributes to broader business results.
10.3 Strategic Alignment
Strategic alignment ensures lean projects support business objectives such as cost reduction, delivery improvement, capacity expansion, quality enhancement, or customer responsiveness.
When improvement resources are aligned with strategic priorities, organizations avoid spending effort on low-impact projects merely because they are easy to execute.
10.4 Six Sigma
Six Sigma is a data-driven methodology focused on reducing variation and defects. Statistical analysis is used to understand process behavior, identify critical inputs, and establish controlled improvements.
Lean and Six Sigma are complementary: lean emphasizes flow and waste elimination, while Six Sigma emphasizes variation reduction and process capability.
10.5 DMAIC
DMAIC represents Define, Measure, Analyze, Improve, and Control. It provides a structured sequence for solving persistent performance problems.
Teams define the issue, establish reliable measurements, analyze root causes, implement verified improvements, and introduce controls that preserve the gains.
10.6 Lean Six Sigma
Lean Six Sigma combines lean’s emphasis on speed and waste reduction with Six Sigma’s focus on variation and statistical control.
This integrated approach is particularly useful where processes suffer simultaneously from delays, defects, instability, and unnecessary cost.
10.7 Data Driven Improvement
Data-driven improvement replaces assumption with measurable evidence. Cycle time, scrap, downtime, throughput, inventory, energy use, and process capability can all reveal improvement opportunities.
Reliable data helps teams prioritize problems, validate causes, and quantify results objectively.
10.8 Performance Measurement
Performance measurement determines whether lean initiatives create sustained operational value. Metrics should connect directly to customer, process, and financial outcomes.
Too many indicators can create confusion. A focused set of meaningful KPIs provides clearer direction and accountability.
11. Lean Manufacturing Tool Implementation
11.1 Lean Readiness Assessment
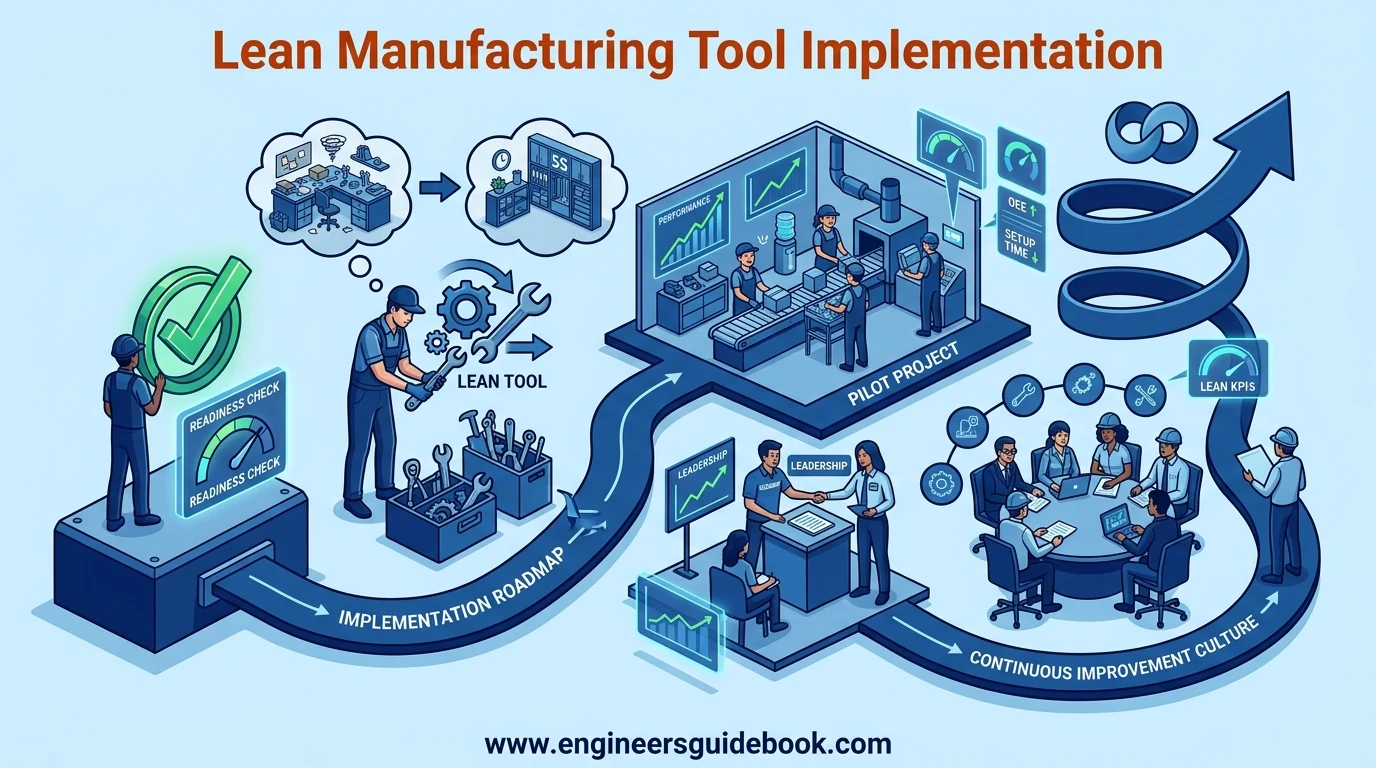
A lean readiness assessment evaluates whether an organization has sufficient leadership support, process discipline, workforce engagement, and data reliability to begin implementation effectively.
Understanding weaknesses beforehand helps establish realistic priorities.
11.2 Tool Selection
Lean tools should be chosen according to the diagnosed problem. 5S may address workplace disorder, SMED may improve lengthy changeovers, and Kanban may control excessive inventory.
The problem determines the tool, not the reverse.
11.3 Pilot Projects
Pilot projects allow organizations to test lean concepts within a controlled production area before wider deployment.
Successful pilots provide measurable evidence, reveal implementation challenges, and build internal confidence.
11.4 Employee Training
Employees need to understand both how lean tools work and why they are being introduced.
Practical training, coaching, and shop-floor participation help convert theoretical knowledge into repeatable operational behavior.
11.5 Management Commitment
Leadership must provide direction, resources, and consistent reinforcement. Employees quickly recognize when lean is treated as a temporary campaign.
Visible management participation gives improvement activities legitimacy and momentum.
11.6 Cross Functional Teams
Cross-functional teams combine knowledge from production, maintenance, quality, engineering, supply chain, and other functions.
This broader perspective improves root cause analysis and prevents local improvements from creating problems elsewhere.
11.7 Lean KPIs
Useful lean KPIs include lead time, OEE, first-pass yield, inventory turnover, setup time, scrap rate, takt adherence, downtime, and on-time delivery.
Measures should demonstrate whether improvements are changing actual process performance.
11.8 Implementation Roadmap
A lean implementation roadmap defines priorities, phases, responsibilities, milestones, and performance targets.
A phased approach allows organizations to develop capability gradually while sustaining earlier improvements.
11.9 Common Implementation Mistakes
Common mistakes include implementing tools without understanding problems, pursuing too many projects, ignoring employees, failing to standardize improvements, and focusing solely on cost reduction.
Another frequent error is expecting immediate transformation. Lean maturity develops through sustained organizational discipline.
11.10 Continuous Improvement Culture
A continuous improvement culture encourages employees to identify abnormalities, question inefficient routines, and suggest practical improvements.
When experimentation and learning become normal workplace behaviors, lean shifts from a project into a management system.
12. Lean Manufacturing Tools FAQs
12.1 What Are the Most Common Lean Manufacturing Tools
The most common lean manufacturing tools include 5S, Kaizen, Kanban, value stream mapping, Standard Work, Poka Yoke, Jidoka, TPM, SMED, takt time, Heijunka, PDCA, and 5 Whys.
12.2 What Are the Five Main Lean Manufacturing Techniques
Five widely used techniques are 5S for workplace organization, Kaizen for continuous improvement, Kanban for pull control, value stream mapping for process analysis, and Standard Work for process consistency.
12.3 Which Lean Tool Should Be Implemented First
There is no universal first tool. However, 5S and value stream mapping are often useful starting points because they improve workplace visibility and expose major process inefficiencies.
12.4 What Is the Best Lean Tool for Waste Reduction
Value stream mapping is particularly effective for identifying waste across an entire process. Kaizen, 5S, Kanban, and continuous flow can then address specific losses discovered during analysis.
12.5 What Is the Difference Between Kaizen and 5S
Kaizen is a broad philosophy of continuous improvement, whereas 5S is a specific workplace organization methodology. 5S can be used as one component of a wider Kaizen system.
12.6 What Is the Difference Between Kanban and Just in Time
Just in Time is a production philosophy centered on supplying what is needed when it is needed. Kanban is a signaling mechanism commonly used to regulate the pull and replenishment required to support JIT.
12.7 How Does Value Stream Mapping Improve Manufacturing
Value stream mapping reveals waiting, inventory, transportation, information delays, and other inefficiencies across the production system. It helps teams redesign processes around improved flow and reduced lead time.
12.8 How Can Lean Manufacturing Reduce Production Costs
Lean manufacturing reduces costs by eliminating waste, decreasing defects, lowering inventory, shortening setups, improving equipment utilization, reducing unnecessary movement, and simplifying workflow.
12.9 What Lean Tools Improve Equipment Efficiency
TPM, OEE, Autonomous Maintenance, Planned Maintenance, SMED, Standard Work, and root cause analysis can improve equipment efficiency by reducing downtime, speed losses, defects, and changeover delays.
12.10 How Do You Measure the Success of Lean Manufacturing
Lean success can be measured through improvements in lead time, productivity, OEE, quality, inventory, delivery performance, setup time, downtime, safety, customer satisfaction, and cost.
13. Conclusion
The effectiveness of lean manufacturing depends on selecting tools that match actual operational problems. Organizations should diagnose process weaknesses before introducing techniques and establish measurable objectives for every improvement activity.
Sustainable lean improvement requires more than isolated workshops. Standardization, employee participation, leadership discipline, performance measurement, and regular follow-up are essential for preserving gains.
The objective is to establish systems that continue improving after individual projects end.
Lean manufacturing is an ongoing journey rather than a finite program. Processes, technologies, customer expectations, and operating conditions continue to change.